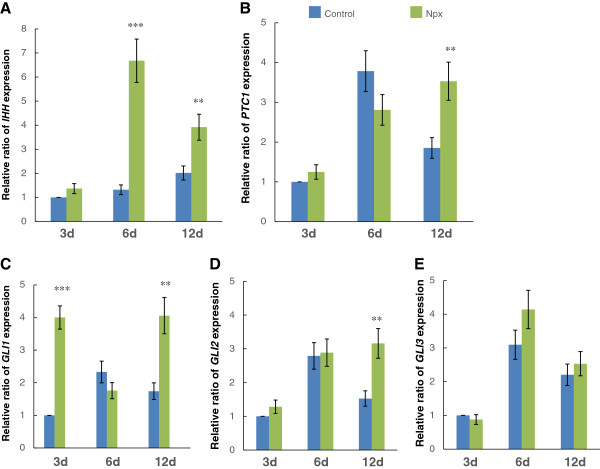
Figure 4.

The relative ratio of IHH (A), PTC1 (B), GLI1 (C), GLI2 (D) and GLI3 (E) expression in mesenchymal stem cells (MSCs) cultured in osteogenic differentiation medium without (control) or with 0.5 μM naproxen (Npx) for 3, 6, and 12 days. The results are shown as mean ± SD of three independent experiments with MSCs from three different donors. **P <0.01 versus control; ***P <0.001 versus control.
