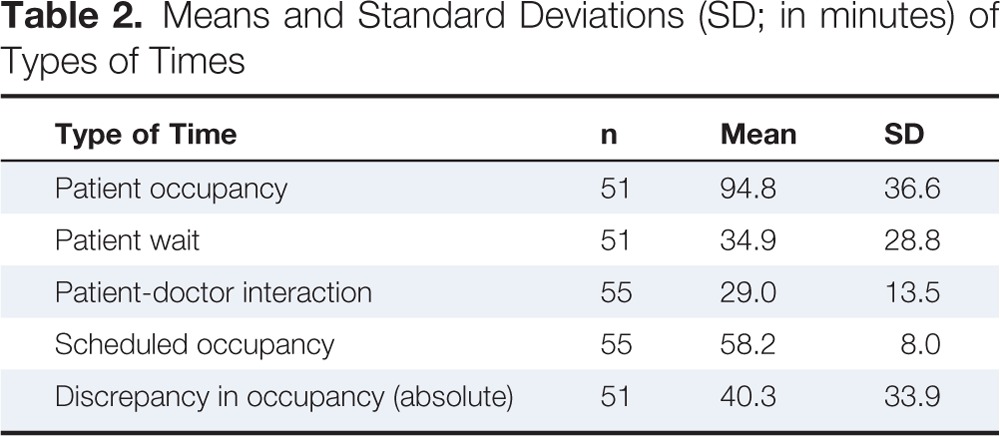
Table 2.
Means and Standard Deviations (SD; in minutes) of Types of Times

| Type of Time | n | Mean | SD |
|---|---|---|---|
| Patient occupancy | 51 | 94.8 | 36.6 |
| Patient wait | 51 | 34.9 | 28.8 |
| Patient-doctor interaction | 55 | 29.0 | 13.5 |
| Scheduled occupancy | 55 | 58.2 | 8.0 |
| Discrepancy in occupancy (absolute) | 51 | 40.3 | 33.9 |
