
Figure 3.
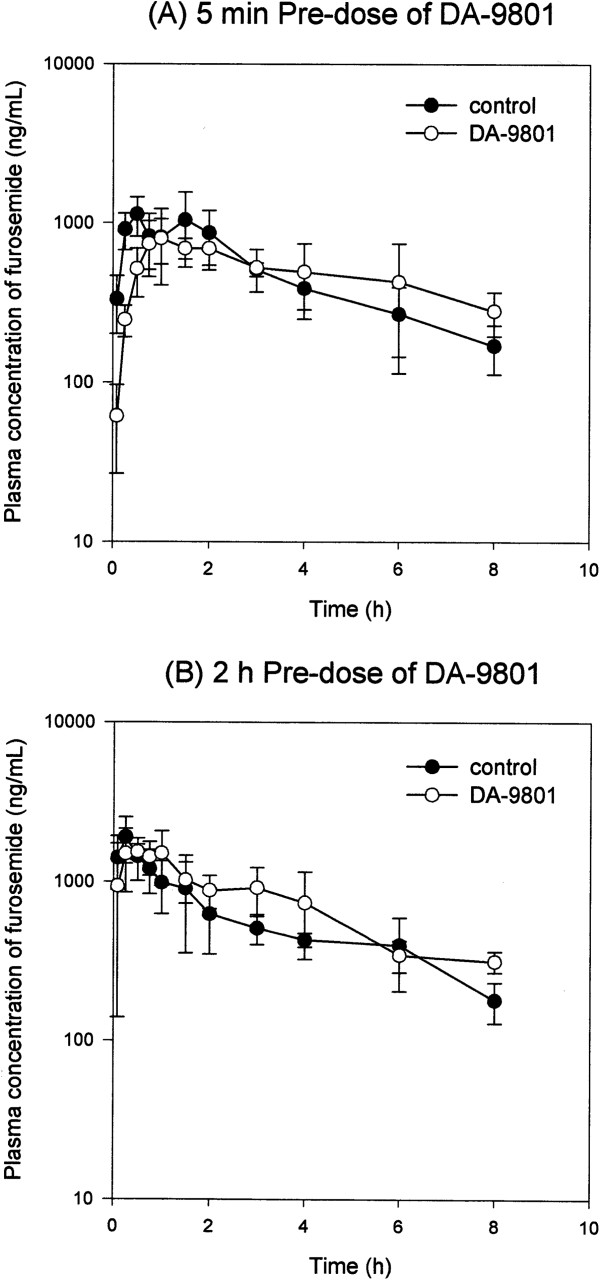
Plasma concentration-time curves of furosemide. (A) Plasma concentration profile of furosemide in rats after oral administration of 10 mg/kg furosemide alone (●) and furosemide with 5 min pre-dose of 1,000 mg/kg DA-9801 (○). (B) Plasma concentration profile of furosemide in rats after oral administration of 10 mg/kg furosemide alone (●) and furosemide with 2 h pre-dose of 1,000 mg/kg DA-9801 (○). Each data point represents the mean ± S.D. of five rats.