
Figure 5.
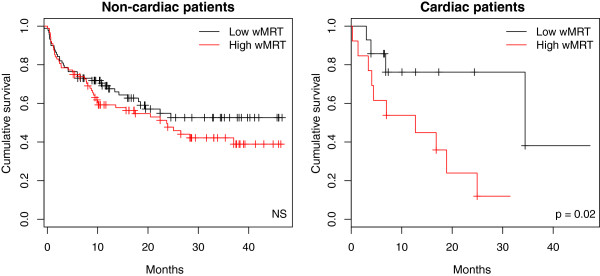
Reparameterized mean response time and time to death and/or hospitalization during follow-up. The Kaplan-Meier curves depict the time to death and/or hospitalization in non-cardiac (left panel) and cardiac (right panel) patients, as a function of the reparameterized mean response time (wMRT) dichotomized (based on the median wMRT: non- cardiac patients: 1.85V10-3, cardiac patients: 1.59×10⁻³) into low vs. high wMRT categories.