
Figure 4.
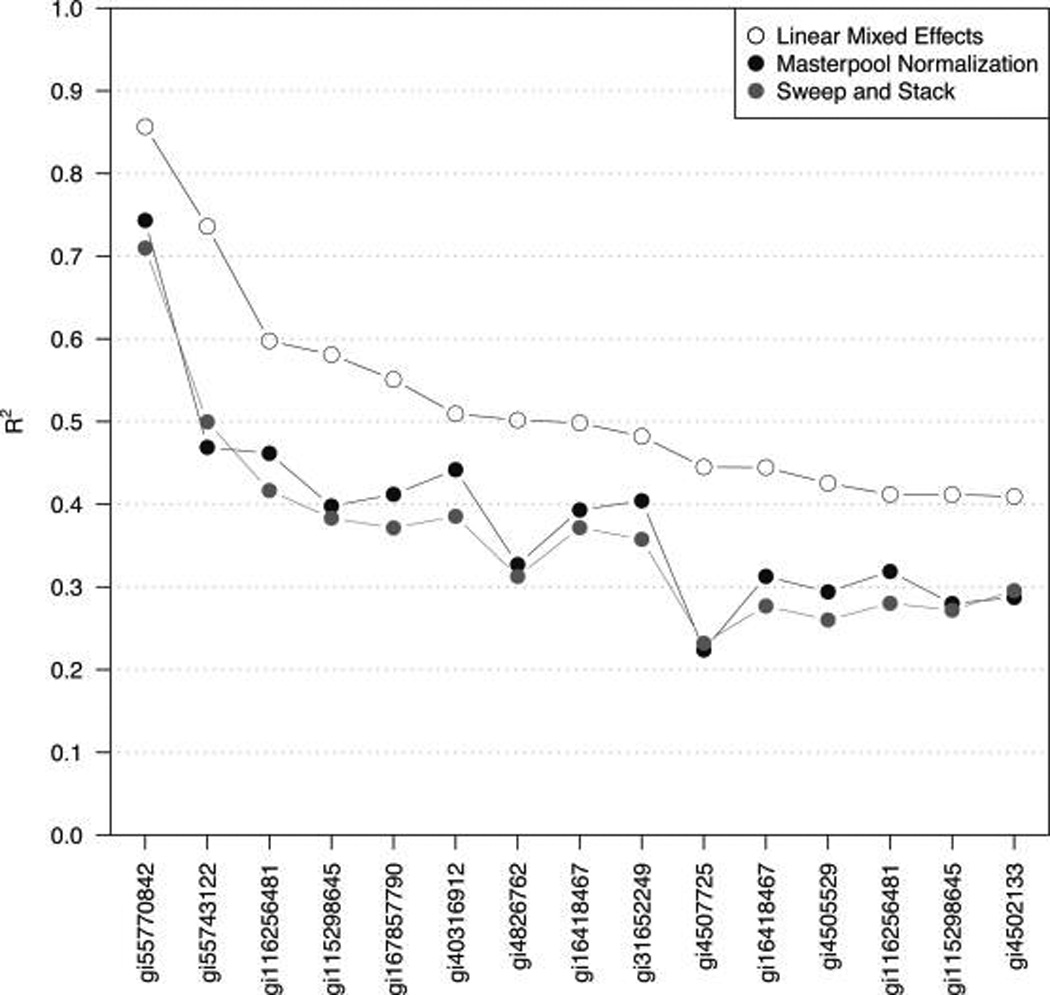
The strongest associations (R2, y-axis) of proteins (accession numbers on the x-axis) with nutrients or indicators of acute phase response observed in our experiments (Table 2). Estimates of relative protein abundance from different experiments were combined using the linear mixed effects model (eq 5), the masterpool normalization, and the median sweep, augmenting (stacking) the estimates from each experiment. The association of RBP4 (accession number gi55743122) and plasma retinol is shown in detail in Figure 3.