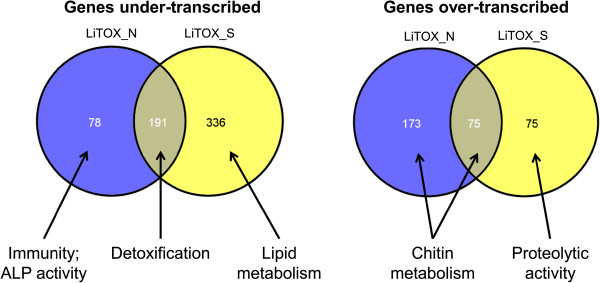
Figure 1.

Genes differentially expressed in LiTOX phenotypes. For each Venn diagram section, the numbers of genes differentially expressed in each LiTOX phenotype as compared to the susceptible strain are indicated, together with the function(s) of these genes based on the list of GO terms significantly enriched (see Additional file 4: Table S4).
