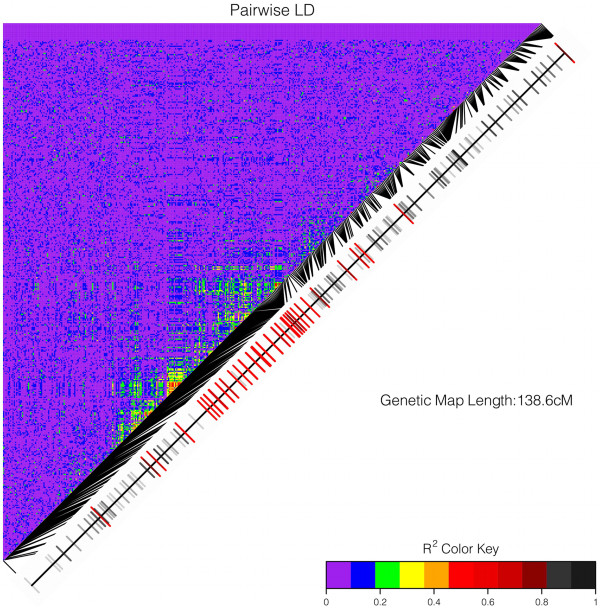
Figure 4.

Pairwise linkage disequilibrium among SNPs on linkage group 5 in sample I852 (Ireland). Linkage map with SNP position in cM is represented on the diagonal of the LD matrix. SNPs under positive selection are colored in red. Black segments connect the SNP positions on the linkage map to the SNP positions on the LD matrix.
