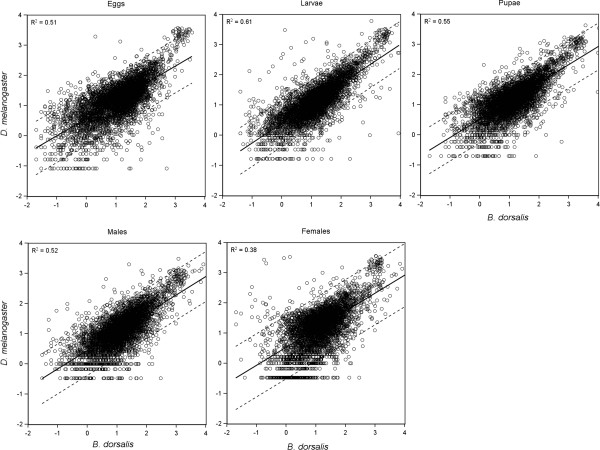
Figure 5.

Regression analysis of log expression values between orthologous unigenes in B. dorsalis and D. melanogaster across developmental stages. Linear regression represented as solid line with 95% confidence interval indicated with dashed lines. Each B. dorsalis unigene with putative ortholog identified in D. melanogaster developmental stage was plotted against the putative ortholog based off of log(10) expression values. Detailed list of each unigene outside of the confidence interval is presented in Additional file 3.
