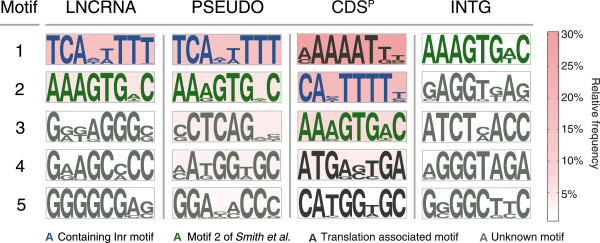
Figure 5.

Promoter sequence distribution. Shown are pictograms and scores for the five best motifs (sorted by motif abundances) of the PSEUDO, LNCRNA, CDSP and INTG sets. Background colour gradient indicates the frequency with which the motifs were identified. Note that the Inr motif of the CDSP set misses the initial ‘T’; manual inspection revealed that 64% did however encode it. Translation initiation motifs containing an ‘ATG’ are only found among the CDSP set.
