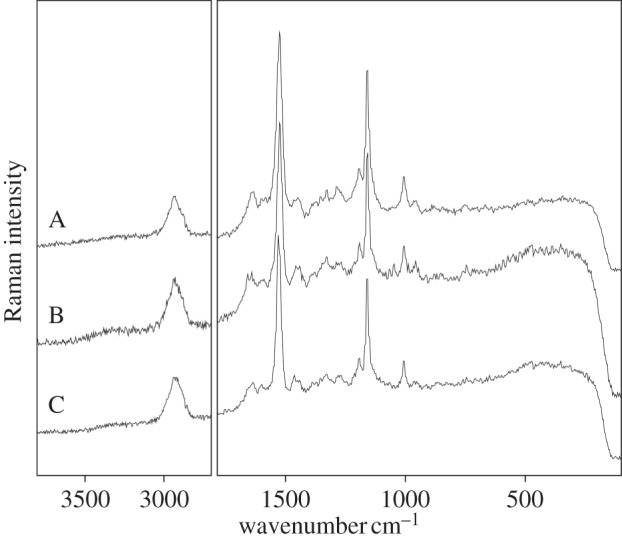
Figure 3.

Examples of Raman spectra obtained using an FT Raman spectrometer (1064 nm) on different microorganisms ((A) Phormidium cf. subfuscum, (B) Porphyridium cruentum and (C) Balbiania investens). Note good resolution of the spectra, presence of a broad band in the second order.
