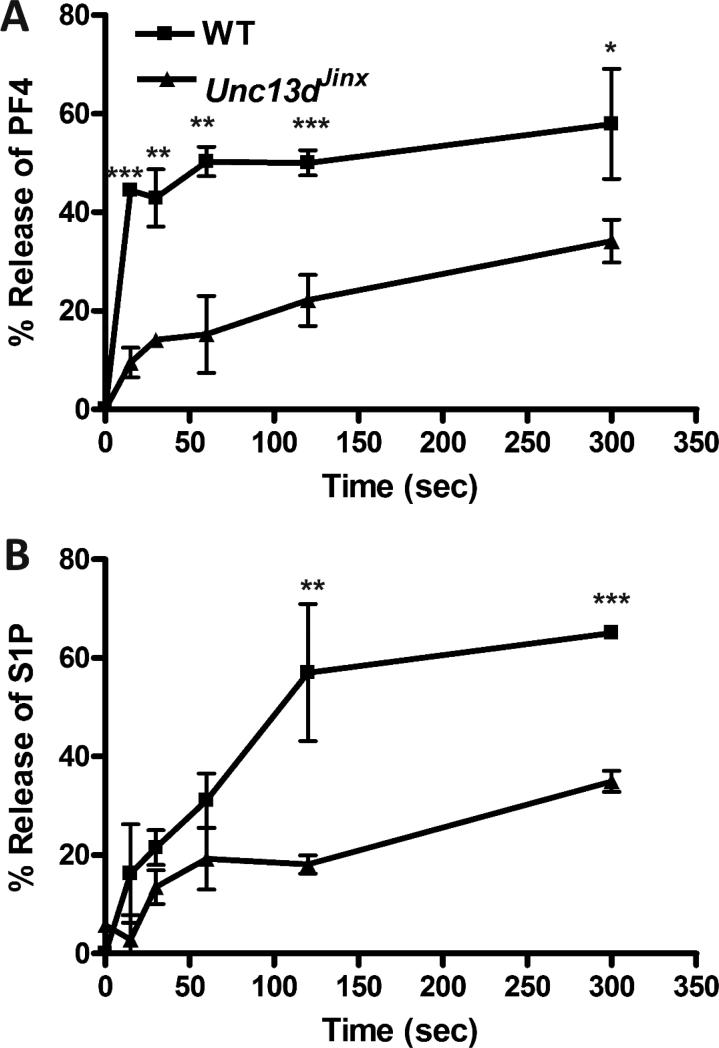
Figure 3. Release of S1P from secretion-defective mouse platelets.
Platelets (2.5×10⁸/mL) were isolated from C57BL/6 (WT, ■), or Unc13dJinx (▲) mice and resuspended in buffer with fatty acid-free BSA (1% (w/v)). They were stimulated with thrombin (0.05 U/mL) for increasing times. The reactions were stopped with hirudin and the platelets were separated from releasate by centrifugation at 13,000×g for 2 min. All the assays for granule cargo were in triplicate. The percentage release of PF4 was determined by ELISA (A) and of S1P by HPLC-MS/MS (B). The data are plotted as percent release vs. time. In both plots, the background of unstimulated release has been subtracted (1.5-5% in A and 5-12% in B). Statistical analysis, at the indicated time points comparing WT to Unc13dJinx platelets, was done using the unpaired two-tailed student's t-test (*, p≤0.05; **, p≤0.01; ***, p≤0.005).

