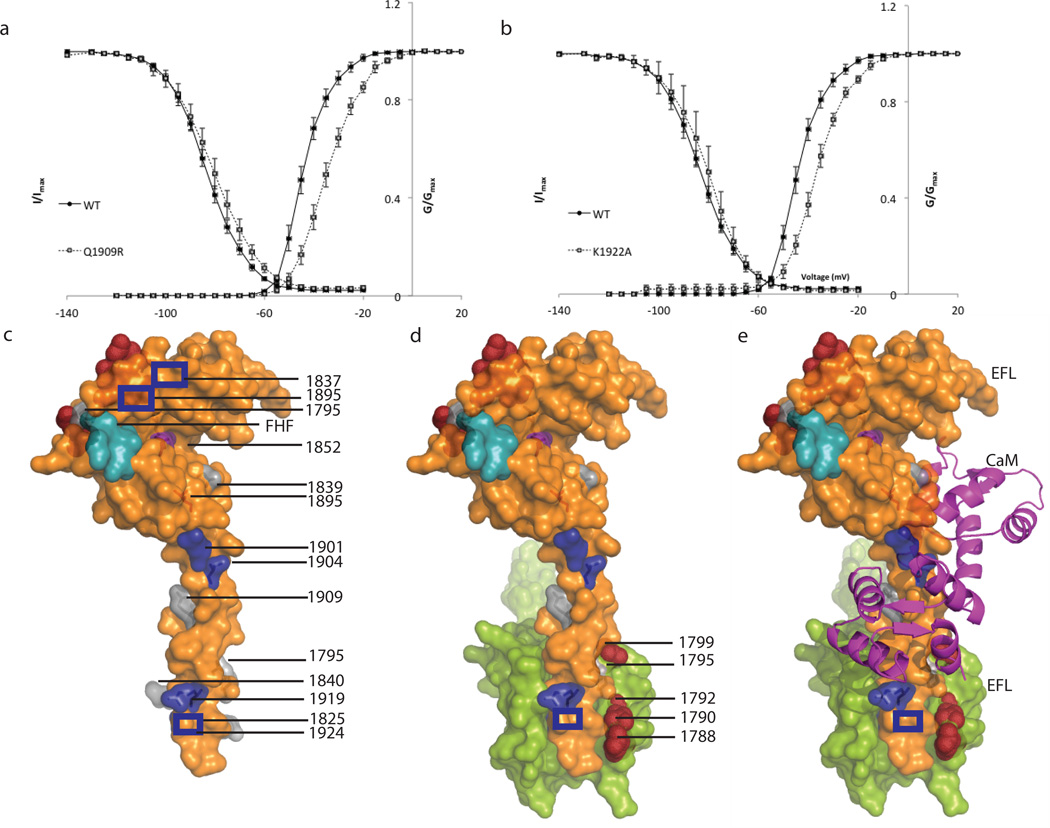
Figure 7. Mutations affecting CTNav1.5-CaM and CTNav1.5-CTNav1.5 interactions.
(a) and (b). Electrophysiological features of Na+ channel variants altered at the CTNav1.5-CaM-Ca2+ interaction interface. Activation and steady state inactivation of wild type (circles) and mutant channels (squares). The data are fit to a Boltzman function as described in Methods. Mutant channels and Q1909R and K1922A exhibit a depolarizing shift in the V0.5 of inactivation (Supplementary Fig. 5). (c) Surface representation of one monomer (orange) interacting with a neighboring molecule (lime green). CTNav1.5 with LQT3 mutations (1795,1825, 1840,1895,1909 and 1924) shown in grey and brugada syndrome mutations in blue (1837,1901,1904,1919). Epilepsy mutations at the interface with CaM-C-term lobe (1895 and 1852) are shown in purple; Brugada mutations (1901 and 1904) are at the interface of CTNav1.5 with the CaM-C-term lobe (blue) and 1705, 1825, 1840, 1924 are at the CTNav1.5-CTNav1.5 interface. Residues 1788, 1790, 1792, 1799, shown in dark red, line the EFL binding site for helix αVI residues past the IQ motif 14. Residues of the FGF13 that contact the EFL domain are colored turquoise. (d) Same as (c) displaying the neighboring CTNav1.5(e) Same orientation as in panels c and d including CaM as a magenta ribbon.

