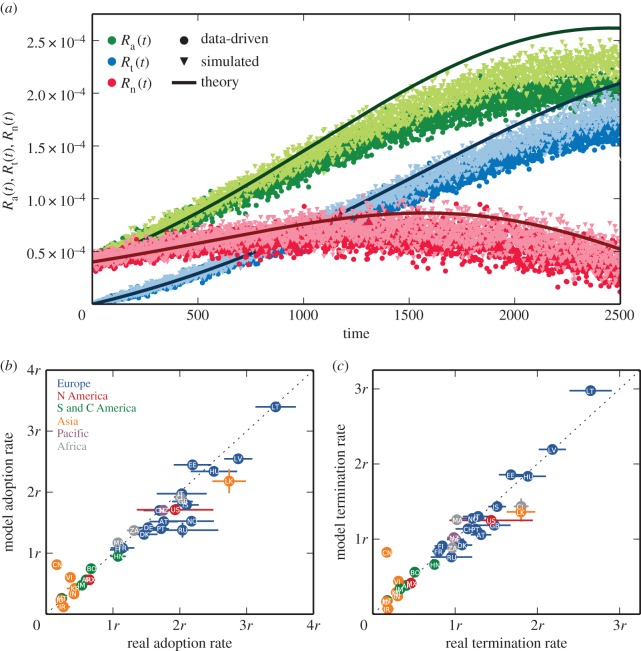
Figure 3.
Data-driven simulations and validation of model predictions. (a) Rates of the model process over the integrated Skype network of Switzerland (dark symbols) and over an uncorrelated scale-free network (light symbols) with similar size and average degree. Parameter values for the numerical simulations are arbitrarily set to pa = 0.00004, pp = 0.0024, ps = 0.0004 and pr = 0.0008. Solid lines indicate the theoretical rates calculated from equations (2.7) and (2.8). Similar scaling of the data-driven, simulated and theoretical curves suggests a minor effect of structural correlations. (b,c) Comparison between empirical and theoretical values of the rates of adoption and termination for 34 different countries. Symbols depict rates averaged over the last six months of the observation period, with their corresponding standard deviations as error bars. In-symbol letters are country abbreviations, colours denote continental territories, r is an arbitrary linear scaling constant and the dashed line is a linear function with unit slope.

