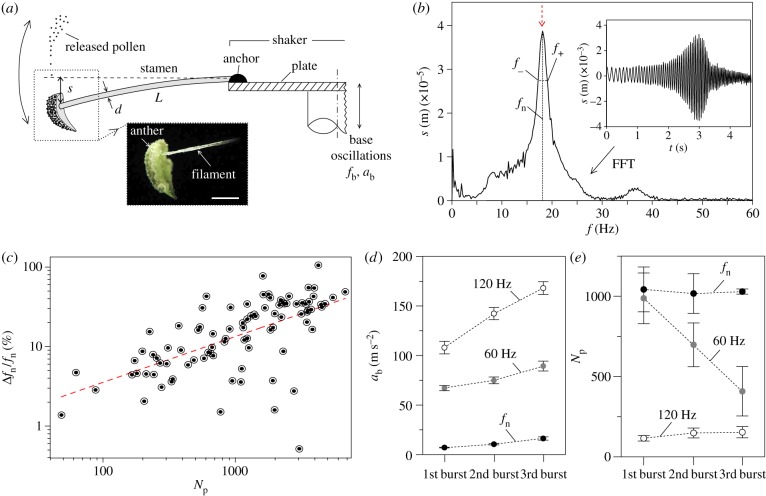
Figure 1.
Results obtained in laboratory experiments. (a) Schematic of the experimental set-up for laboratory measurements of the mechanical properties of stamens, including a photograph of a sample used in the tests (inset; scale bar, 1 mm). (b) Sample time series of the anther displacement during a frequency sweep in the electrodynamic shaker (inset), and corresponding fast Fourier transform (main frame), with red dashed arrow indicating resonance condition. (c) Relative increments of the measured resonance frequency as a function of the number of pollen grains released after a single burst, including a linear regression model (dashed red line). (d) RMS vertical acceleration of the plate at three consecutive bursts, with base frequency tuned to 120 Hz (white dots), 60 Hz (grey dots) and to the natural frequency (black dots). (e) Recorded number of pollen grains shed at three consecutive bursts with base frequency tuned to 120 Hz (white dots), 60 Hz (grey dots) and to the natural frequency (black dots). Error bars represent the standard deviation. (Online version in colour.)

