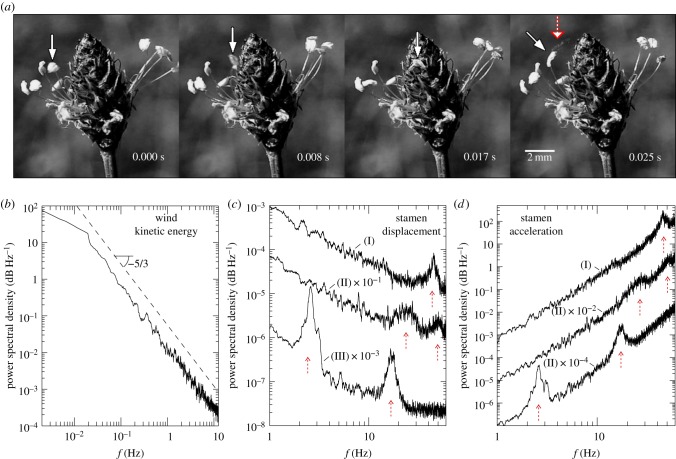
Figure 2.
Results obtained in field experiments. (a) Sequential high-speed images from field observations of stamen II (white solid arrow), including a pollen release event (red/white dashed arrow). (b) Averaged frequency spectrum of the wind turbulent kinetic energy. Also included are PSDs of (c) the displacement and (d) acceleration of stamens I, II and III, including approximate resonance conditions (red dashed arrows). (Online version in colour.)

