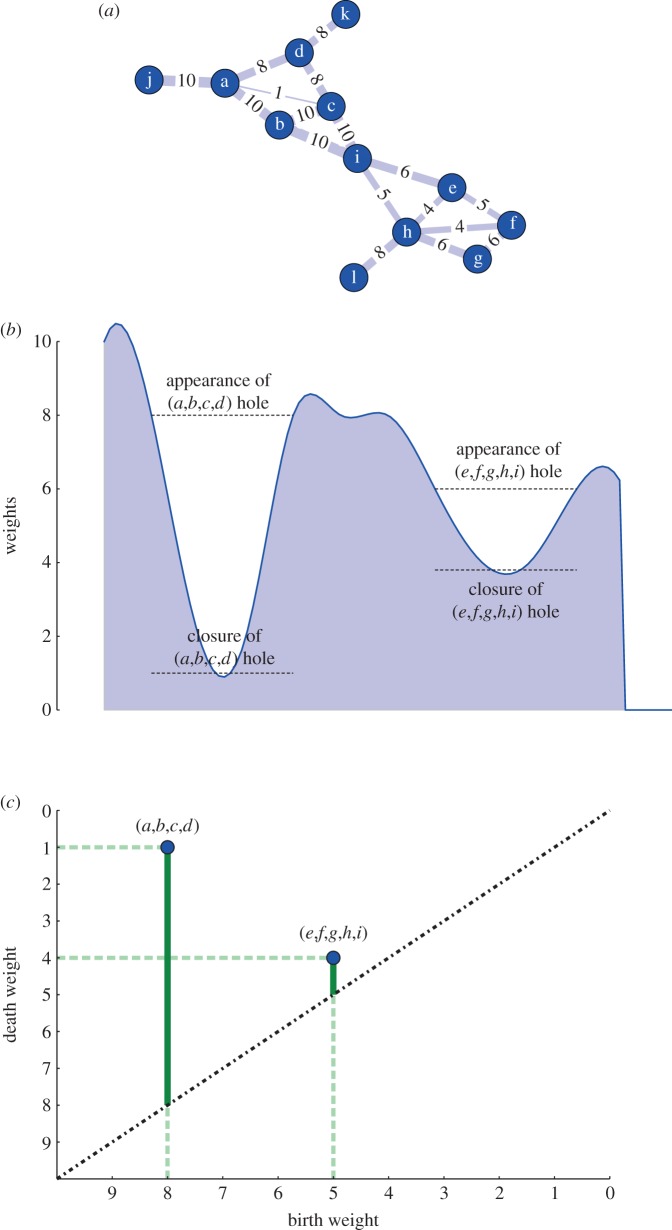
Figure 2.
Panels (a–c) display a weighted network (a), its intuitive representation in terms of a stratigraphy in the weight structure according the weight filtration described in the main text (b) and the persistence diagram for H1 associated with the network shown (c). By promoting cliques to simplices, we identify network connectivity with relations between the vertices defining the simplicial complex. By producing a sequence of networks through the filtration, we can study the emergence and relative significance of specific features along the filtration. In this example, the hole defined by (a,b,c,d) has a longer persistence (vertical solid green bars) implying that the boundary of the cycle are much heavier than the internal links that eventually close it. The other hole instead has a much shorter persistence, surviving only for one step and is therefore considered less important in the description of the network homological properties. Note that the births and deaths are defined along the sequence of descending edge weights in the network, not in time. (Online version in colour.)

