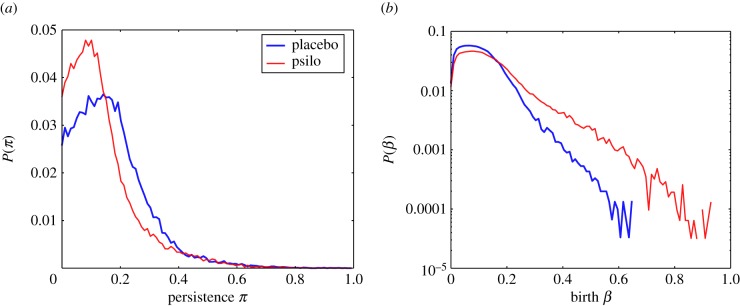
Figure 4.

Comparison of persistence π and birth β distributions. Panel (a) reports the H1 generators' persistence distributions for the placebo group (blue line) and psilocybin group (red line). Panel (b) reports the distributions of births with the same colour scheme. It is very easy to see that the generators in the psilocybin condition have persistence peaked at shorter values and a wider range of birth times when compared with the placebo condition. (Online version in colour.)
