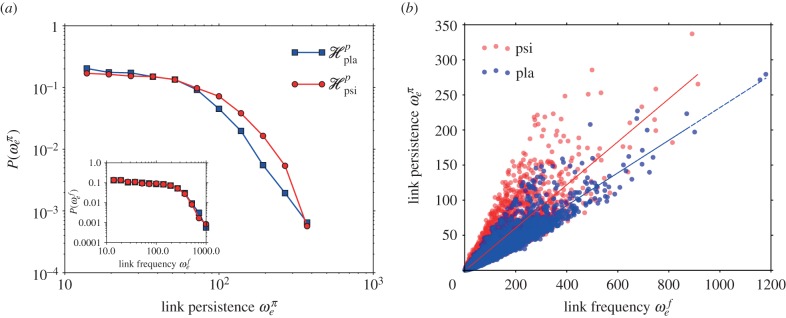
Figure 5.

Statistical features of group homological scaffolds. Panel (a) reports the (log-binned) probability distributions for the edge weights in the persistence homological scaffolds (main plot) and the frequency homological scaffolds (inset). While the weights in the frequency scaffold are not significantly different, the weight distributions for the persistence scaffold display clearly a broader tail. Panel (b) shows instead the scatter plot of the edge frequency versus total persistence. In both cases, there is a clear linear relationship between the two, with a large slope in the psilocybin case. Moreover, the psilocybin scaffold has a larger spread in the frequency and total persistence of individual edges, hinting to a different local functional structure within the functional network of the drugged brains. (Online version in colour.)
