Figure 6.

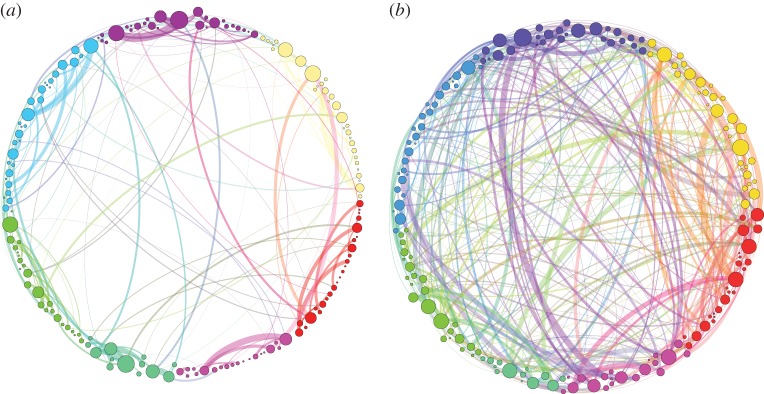
Simplified visualization of the persistence homological scaffolds. The persistence homological scaffolds  (a) and
  (b) are shown for comparison. For ease of visualization, only the links heavier than 80 (the weight at which the distributions in figure 5a bifurcate) are shown. This value is slightly smaller than the bifurcation point of the weights distributions in figure 5a. In both networks, colours represent communities obtained by modularity [49] optimization on the placebo persistence scaffold using the Louvain method [50] and are used to show the departure of the psilocybin connectivity structure from the placebo baseline. The width of the links is proportional to their weight and the size of the nodes is proportional to their strength. Note that the proportion of heavy links between communities is much higher (and very different) in the psilocybin group, suggesting greater integration. A labelled version of the two scaffolds is available as GEXF graph files as the electronic supplementary material. (Online version in colour.)
