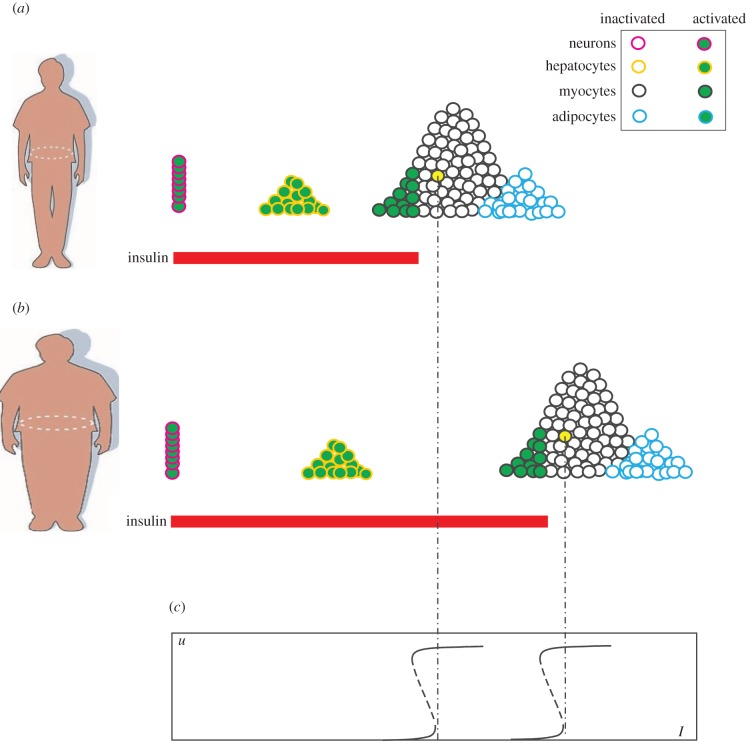
Figure 7.
A schematic view of four different types of cell and their distribution over Ion. (a) Normality. A pulse of insulin activates only a small portion of the cells. (b) Obesity. The majority of cells have enlarged Ion values. The pancreas has to secrete more insulin to achieve the same level of glucose disposal (i.e. activate the same number of cells). (c) The bistable responses of the yellow cell. The left (right) one is for the normal (obese) person.

