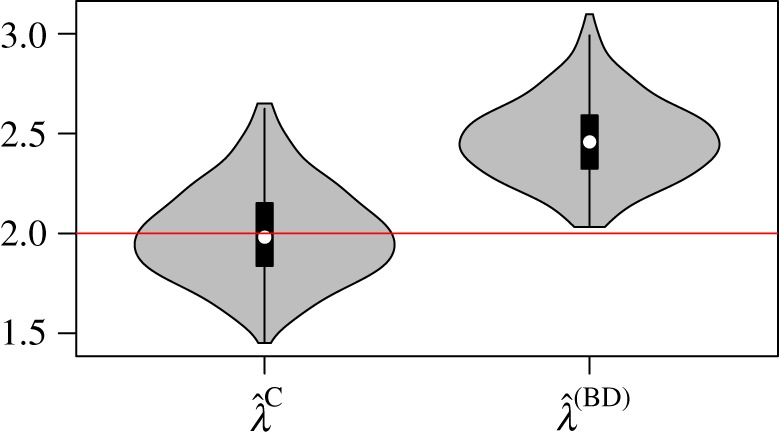
Figure 8.

MLE birth rates based on simulations with a 50% sample fraction, n = 100, and with a time-dependent sampling rate that increases through time. Left distribution of MLE birth rates from 300 simulations and using BDM and CoM estimators. (Online version in colour.)
