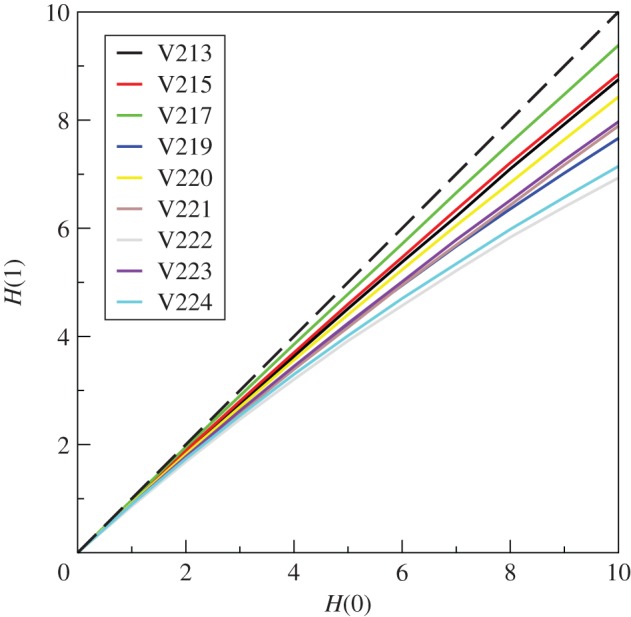
Figure 4.

Evolution of the initial Hamming distances, H(0) with one time step to H(1), for networks obtained from nine different colonies of R. marginata. The dynamics corresponding to each of the H(0) is averaged over 105 different initial random configurations. The dashed line signifies H(1) = H(0). Legends show colony identities. (Online version in colour.)
