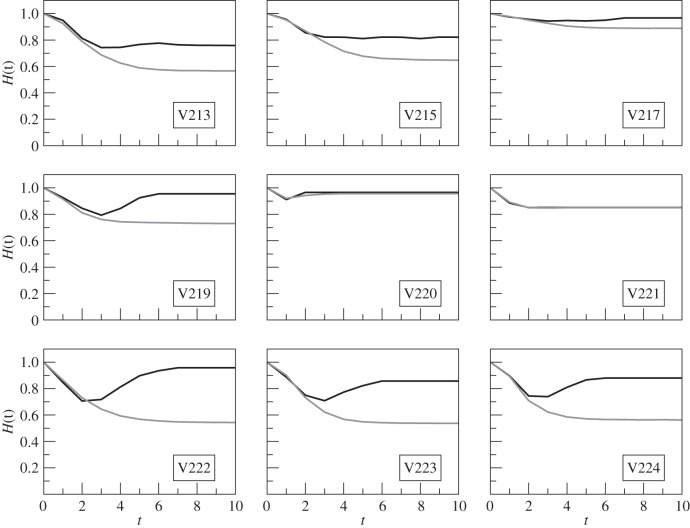
Figure 6.
The time evolution of the Hamming distances starting from H(0) = 1, for networks obtained from nine different colonies of R. marginata. Black solid curves represent original networks, the dynamics corresponding to each of the H(0) is averaged over 104 random initial conditions. Each original network is randomized 102 times and the dynamics being averaged over 104 initial configurations (grey solid curves). Legends show colony identities.

