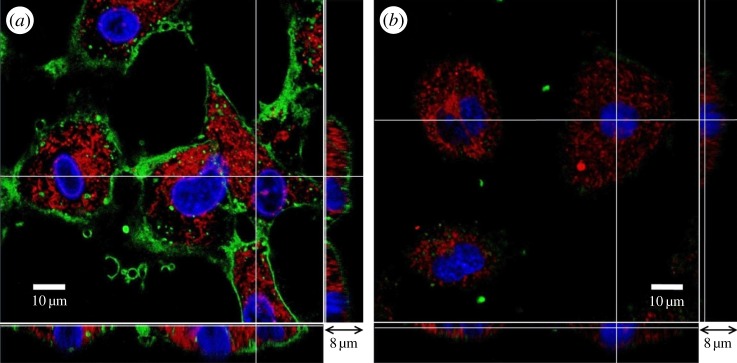
Figure 1.

Three-dimensional confocal images of HUVECs. (a) Control, (b) neuraminidase-treated. The main panel shows the enface image at a given z-depth. The bottom and side panels show the x–z and y–z cross-sectional images, respectively. Scale bar in the main panel, 10 µm, and scale bar in the bottom and side panels, 8 µm.
