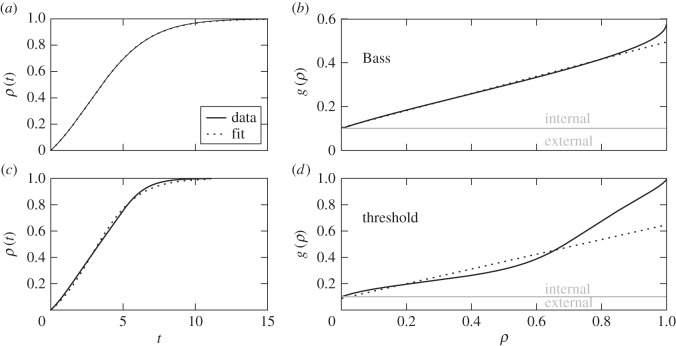
Figure 2.
Application of time-series estimations to surrogate data. The Bass (a,b) and threshold (c,d) dynamics with parameters a = 0.1 and b = 0.5 were numerically solved in the AME framework for scale-free networks (with degree distribution  with
with  for
for  such that
  ). (a,c) Adoption curve ρ(t) (fraction of adopted agents over time). (b,d) Numerical estimate of g(ρ), obtained from ρ(t) by inverting equation (2.2). Dashed curves correspond to the fit of equation (1.2) to ρ(t). Estimations of G correspond to the area between the horizontal grey line (
 ) and the solid (
 ) or dashed (
 ) curves in (b,d). Results: Bass
  ; threshold
  .
.

