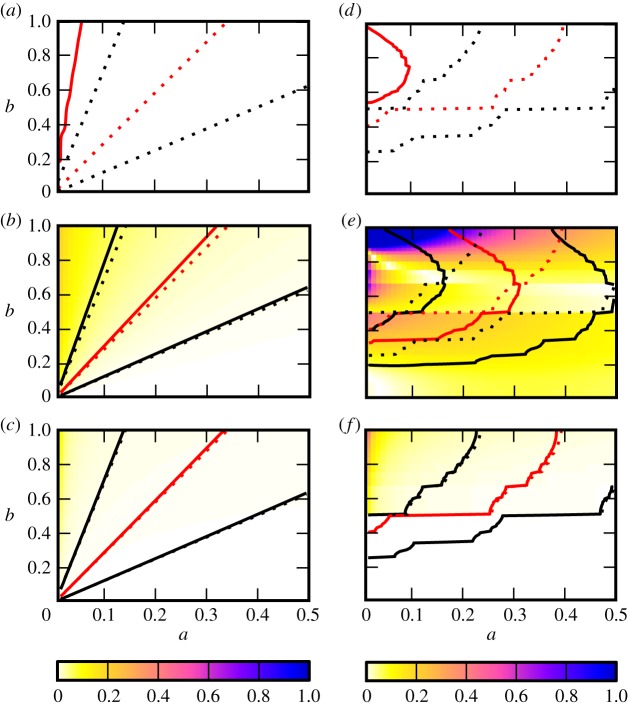
Figure 3.
Strength of endogenous factors G in the Bass [equation (4.1), panels (a,b,c)] and threshold [equation (4.2), panels (d,e,f)] models for different parameters a and b. The dashed lines correspond to values of a,b for which G = 1/2 (centre, red), G = 1/3 (black below red) and G = 2/3 (black above red), computed from equation (2.5). The different panels show the estimations based on L (a,d),  (b,e) and
  (c,f). Solid lines indicate values of a,b for which values 1/2, 1/3 and 2/3 were obtained and should be compared to the corresponding dashed lines. The colour code indicates the relative errors between the true value G and the estimated values
  (b,e) and
  (c,f). The model dynamics was simulated for scale-free networks with the same parameters as in figure 2. (Online version in colour.)

