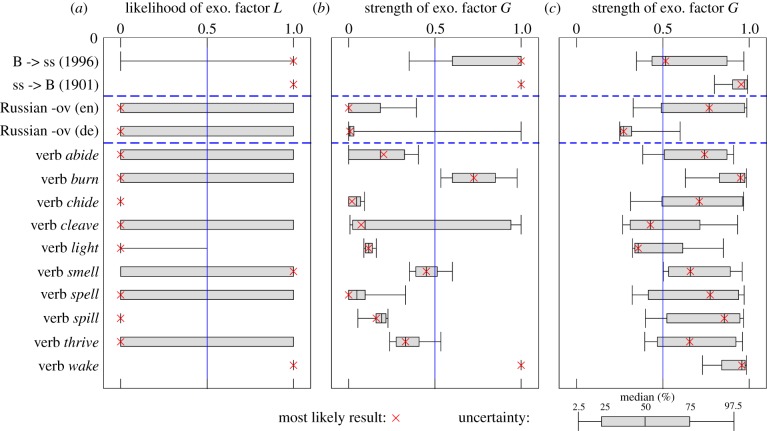
Figure 4.
Estimation of the strength of exogenous factors in empirical data. The red × indicates the estimated value obtained using the complete database. The box plots (grey box and black bars) were computed using bootstrapping and quantify the uncertainty of the estimated value (from left to right, the horizontal bars in the boxplot indicate the 2.5, 25, 50, 75 and 97.5% percentile). Panels (a–c) show the estimations based on the three methods proposed in §3. (a) Method 1: the likelihood ratio L of the exponential fit (exogenous factors) in relation to the symmetric S-curve fit (endogenous factors). (b) Method 2: estimation  based on the fit of equation (1.2) and on equation (2.4). Method 3: estimation
  based on the general population dynamics model 4 (see the electronic supplementary material, section III, for details on the implementation of the three methods and for figures of individual adoption curves). (Online version in colour.)

