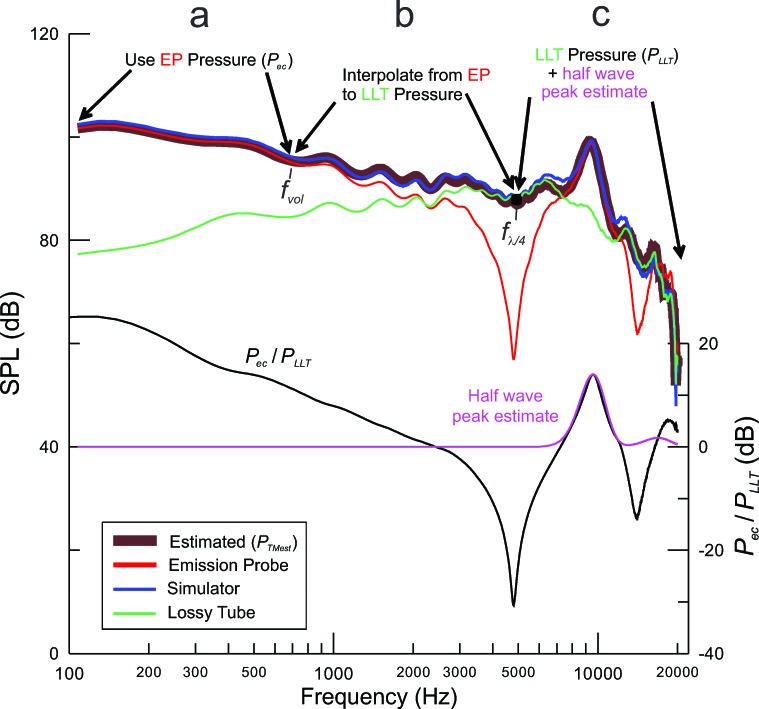
FIG. 1.
Illustration of the method to estimate eardrum pressure (PTMest). The thick brown line is the estimated eardrum SPL. (a) The estimate relies on the pressure measured directly by the probe (Pec) (red curve) at low frequencies (≤ fvol) where the pressure at the eardrum can be assumed equal to Pec. (b) The pressure between fvol and the frequency of the first quarter-wave null (fλ/4) above is calculated using an interpolation described in the text. (c) The eardrum pressure at frequencies above fλ/4 is calculated as the sum of the system's response in a long lossy tube (PLLT) (green) and an estimate of half-wave resonances measured in the ear (magenta). The half-wave resonances are estimated by fitting a Gaussian curve to peaks detected in the pressure response measured in the ear normalized by the pressure response in the long tube (Pec/PLLT) (black curve in lower plot). The blue curve, representing the pressure measured by the microphone of the ear simulator, demonstrates the accuracy of the estimated pressure.

