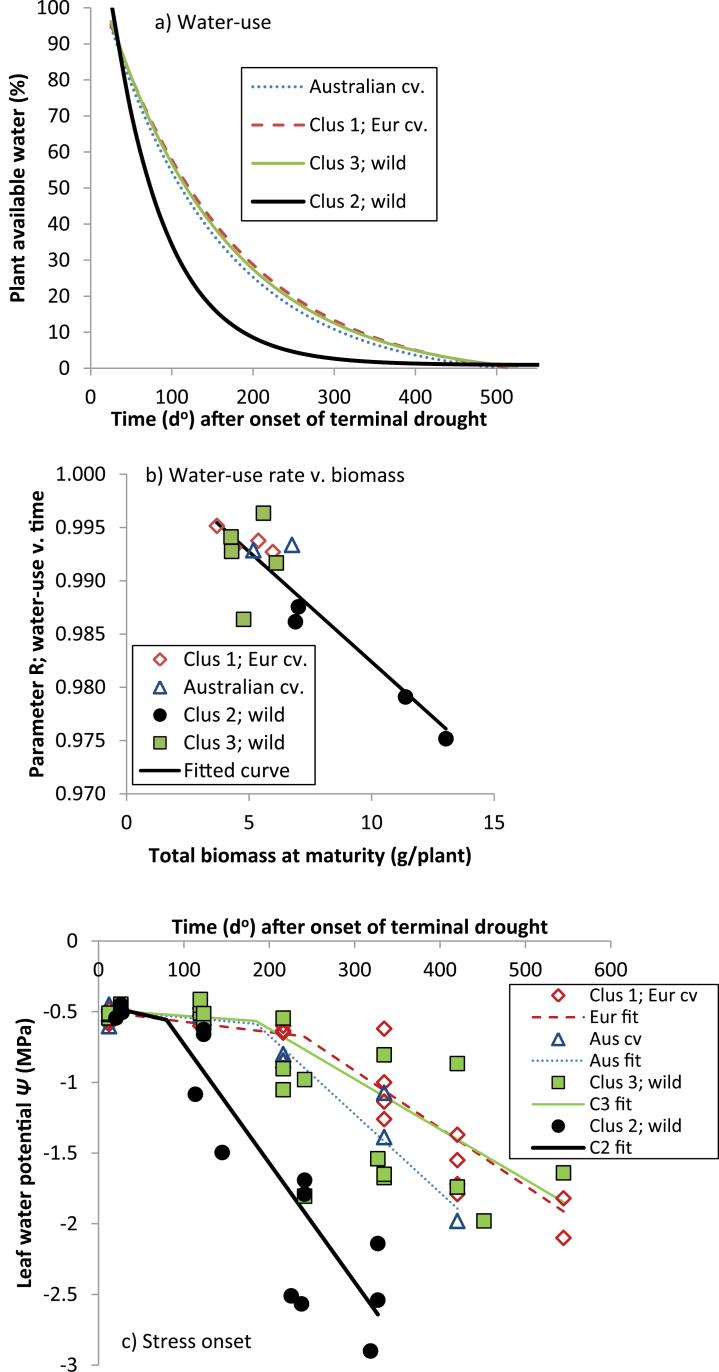
Fig. 3.
Terminal drought water-use (a, b) and stress onset (c) over time in L. luteus in 2008 (2010 data for water-use is similar, and not presented). In (a) exponential curves fitting separate linear and non-linear parameters for clusters explain 91% of variance (93% in 2010). Per cent plant available water (PAW) was calculated using pot weights at field capacity, measured before the onset of terminal drought (1.13 l pot–1). In (b) adjusted r 2=0.78 in a linear regression, fitting a common line to all values. In (c) adjusted r 2=0.69 for a broken stick linear regression, fitting separate slopes for provenance categories. (This figure is available in colour at JXB online.)

