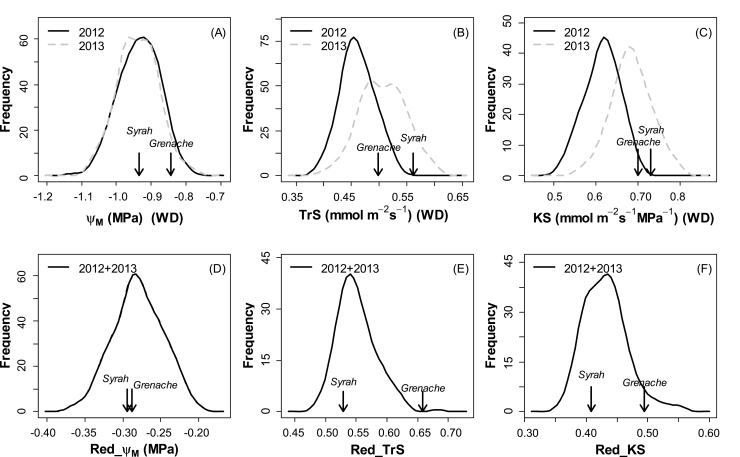
Fig. 4.
Distributions of mean genotypic values (Best Linear Unbiased Predictions; BLUPs) for hydraulic traits measured on the Syrah×Grenache mapping population. See Table 1 for abbreviations. For ΨM (A), TrS (B), and KS (C), distributions obtained under the water deficit treatment are presented for 2012 (black lines) and 2013 (grey lines) for the n=188 genotypes. For Red_ΨM (D), Red_TrS (E), and Red_KS (F), only one mean per genotype was obtained in each year, and the black line represents the distribution of the BLUP extracted from the single means of the two years of the experiment. Values for the parents are indicated with black arrows (only for 2012 in A, B, and C for the sake of clarity).

