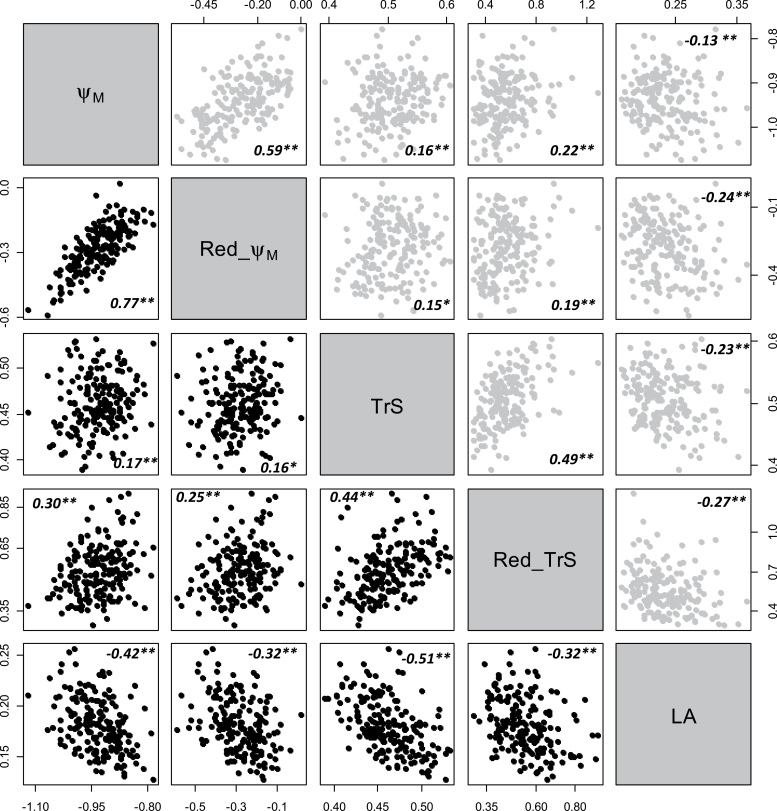
Fig. 5.
Binary relationships and Pearson’s correlation coefficients between hydraulic traits measured under the water deficit scenario on the Syrah×Grenache mapping population. Upper right: biplots between variables measured in 2013 (grey dots). Lower left: biplots between variables measured in 2012 (black dots). See Table 1 for abbreviations. ΨM in MPa, Red_ΨM in MPa, TrS in mmol m–2 s–1, Red_TrS dimensionless, LA in m2. n=188 for each biplot. Pearson’s correlation coefficients are indicated with their statistical significance as follows: *P≤0.01; **P≤0.001.

