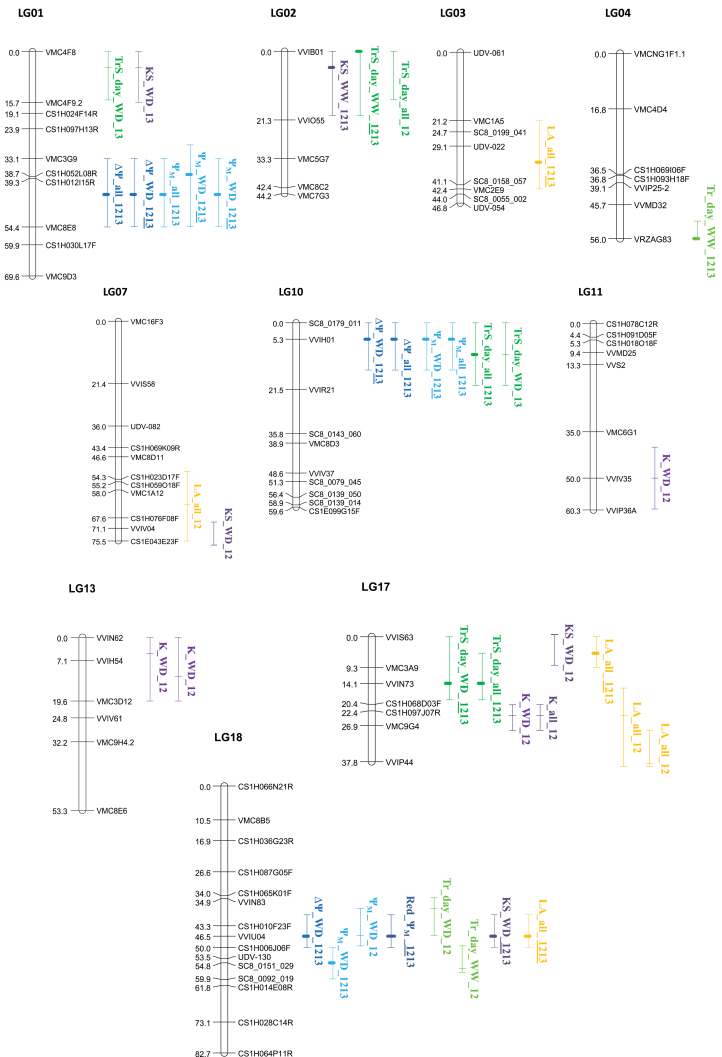
Fig. 6.
Localization of the most significant quantitative trait loci (QTLs) involved in the genetic determinism of the hydraulic-related traits in a Syrah×Grenache mapping population. Central marks on the vertical bars indicate the position L on each linkage group (LG01–LG18) of the consensus map where the maximum LOD score was observed (bold mark for multiyear QTLs and thin mark for 1-year QTLs). Vertical bars are for the LOD–1 confidence intervals around L. QTL names indicate the trait and the conditions (water treatment and years) retained for QTL analysis. QTLs were detected for: ΨM, daytime leaf water potential; Tr and TrS whole-plant and specific transpiration rates, respectively; K and KS, whole-plant and specific hydraulic conductances, respectively; LA, whole-plant leaf area. QTLs represented here are mainly those detected on the multiyear data set (indicated as ‘1213’ in the QTL name). When a QTL was also detected in one specific year as highly significant, the corresponding year is underlined in the QTL name. Highly significant QTLs detected in 1-year but not in multiyear analysis are also represented and identified with the corresponding year ‘12’ or ‘13’ in the QTL name. The middle part of the QTL name indicates either ‘WD’, ‘WW’, or ‘all’ when a QTL was detected respectively using water deficit, well-watered, or all water treatment data sets. (This figure is available in colour at JXB online.)

