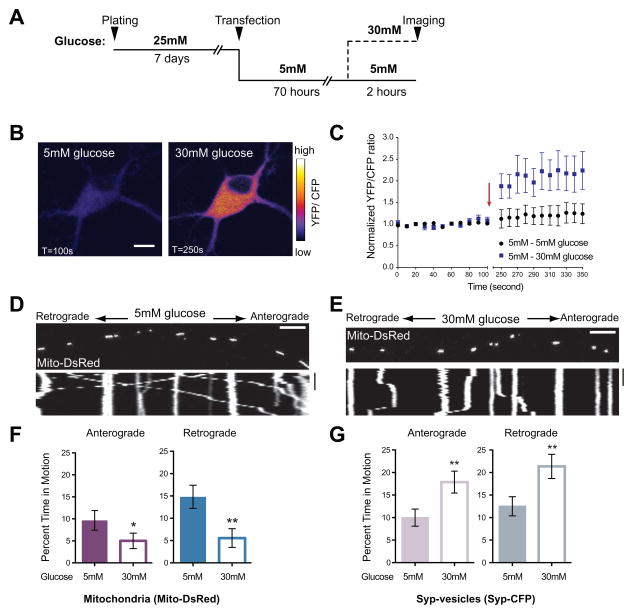
Figure 1. Increased Glucose Decreases Mitochondrial Motility In Rat Hippocampal Axons.
(A) Schematic of the paradigm for changing extracellular glucose.
(B–C) The sensor FLII12Pglu-600μδ6 was expressed in cultured rat hippocampal neurons and the YFP/CFP ratio used to determine intracellular glucose concentration in 5mM and after switching 30mM glucose medium. (B) Pseudocolored pixel by pixel ratio of a neuron before and after the switch to 30mM glucose (scale bar =10μm). (C) Normalized YFP/CFP ratios from neurons cultured in 5mM glucose before and after exchange (arrow) of medium for either fresh 5mM glucose (●) or 30mM glucose. (■). 30mM extracellular glucose caused ~2 fold increase in intracellular glucose (p=0.0007, n>4, 3 independent transfections).
(D–E) Representative kymographs of mitochondrial motility in hippocampal axons transfected with Mito-DsRed and Synaptophysin (Syp)-CFP and imaged after culturing as schematized in (A). Here and in subsequent figures, the first frame of each time-lapse movie is shown above a kymograph generated from that region of axon. The y-axis of each kymograph represents time and the x-axis depicts the position of the organelles such that stationary organelles appear as vertical lines while those moving either anterograde or retrograde are diagonal. Scale bars = 10μm and 100s.
(F–G) The percent time each mitochondrion (F) or Syp-vesicle (G) spent in anterograde and retrograde motion was calculated from kymographs like those in (D–E). n=73–101 mitochondria from 8 axons and n=114–126 vesicles from 7 axons and 4 independent transfections per condition.
*p< 0.05, **p<0.01, Mann-Whitney U test. All values are shown as mean ± SEM. See also Movies S1–S4 and Table S1.

