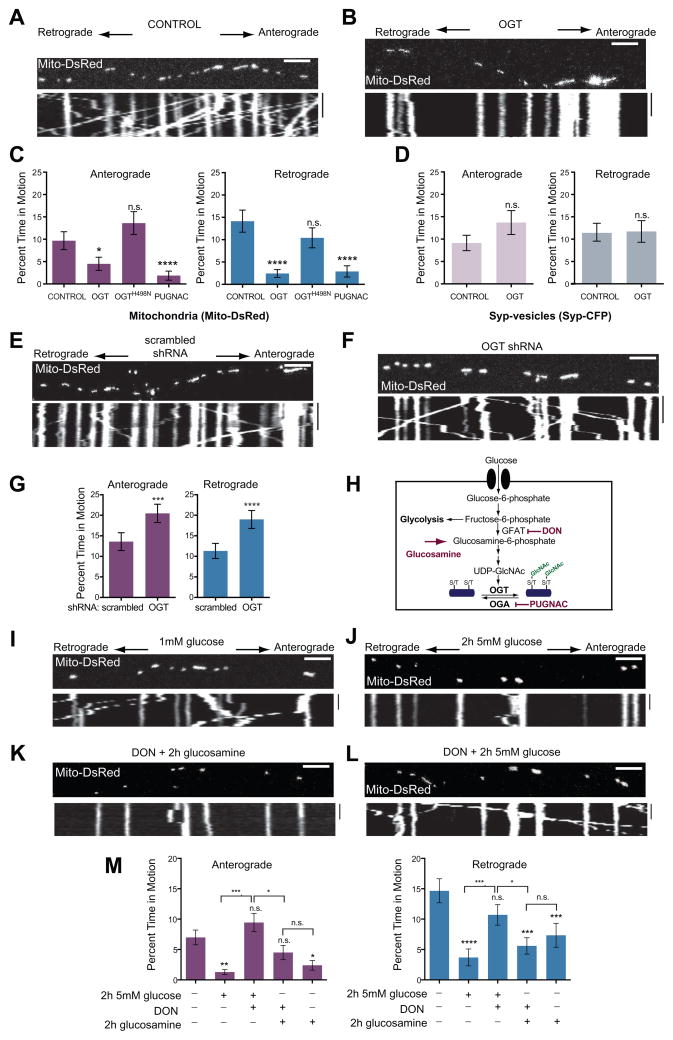
Figure 2. OGT and the Hexosamine Pathway Inhibit Mitochondrial Motility.
(A–D) Kymographs of axons from hippocampal neurons transfected with Mito-DsRed and Syp-CFP, and either with (A) or without (B) OGT, and imaged 3 days after the transfection. (C, D) The percent of time mitochondria (C) and Syp-vesicles (D) spent in motion was quantified from kymographs of either control cultures, or neurons transfected with either OGT or the catalytically inactive OGTH498N or neurons pretreated for 6hrs with 100μM PUGNAC. n=100–129 mitochondria from 8 axons and n=118–165 vesicles from 7–8 axons and 4 independent transfections per condition.
(E–G) Hippocampal neurons were transfected with Mito-DsRed and either a scrambled shRNA (E) or OGT shRNA (F), imaged 4 days after the transfection, and their consequences for mitochondrial motility were quantified (G). n=175–179 mitochondria from 9 axons and 3 independent transfections per condition.
(H) Schematic representation of glucose and glucosamine metabolism by the Hexosamine Biosynthetic Pathway. Rate limiting steps and the inhibitors used in this study are also indicated.
(I–M) Hippocampal neurons, cultured in 5mM glucose were transfected with Mito-DsRed and transferred to media containing 1mM glucose for 48h (similar to Figure 1A). Mitochondrial motility was imaged with the indicated glucose, glucosamine and DON treatments. (I, J) Representative kymograph at 1mM glucose and 2h after shift to 5mM glucose. (K, L) Addition of the GFAT inhibitor DON (100μM) prevented the reduction in motility caused by 5mM glucose (L) but not by 2h exposure to 1mM glucose and 4mM glucosamine (K). (M) Mitochondrial motility was quantified from kymographs as in (I – L). Throughout the experiments in (I–M) medium was supplemented with 1mM lactate and 1mM pyruvate, n=116–199 mitochondria from 8–13 axons and 3–4 independent transfections per condition.
n.s. not significant. *p< 0.05, **p<0.01, ***p<0.001, ****p<0.0001; Kruskal-Wallis test. All values are shown as mean ± SEM. Scale bars = 10μm and 100s. See also Figure S2, Movies S5–S6 and Table S1B.

