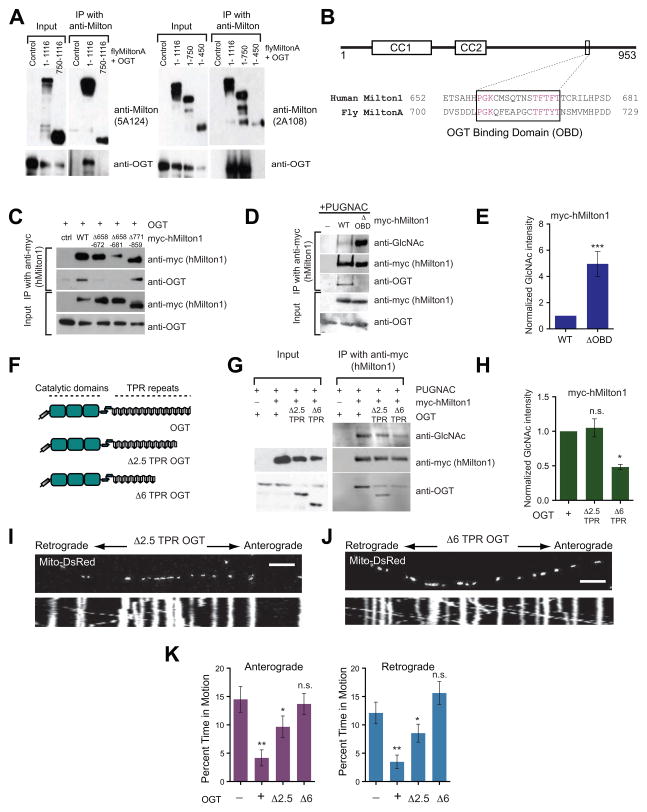
Figure 4. An OGT/Milton Complex Is Not Required for hMilton1 O-GlcNAcylation.
(A) Coimmunoprecipitation of full length or truncated fly MiltonA and OGT proteins from HEK293T cells. Anti-Drosophila Milton antibodies 5A124 (raised against amino acids 908–1055) or 2A108 (raised against amino acids 273–450) were used to immunoprecipitate full length (1–1116) or truncated 750–1116, 1–750, and 1–450 Drosophila MiltonA. Immunoblots were probed with anti-OGT and the appropriate anti-Milton antibodies to identify Milton fragments that could associate with OGT.
(B) Schematic representation of hMilton1 protein and sequence alignment of fly MiltonA (450–750) and hMilton1 (634–953) (see also Figure S4), which were determined to be important for OGT/Milton complex formation. The conserved OGT Binding Domain (OBD) is boxed; conserved amino acids are magenta. Predicted coiled coil domains of hMilton1 (CC1,2) are also illustrated.
(C) Myc-hMilton1 constructs lacking the indicated amino acids were tested for their ability to precipitate coexpressed OGT from HEK293T cells.
(D–E) Full length and Δ658–672 (ΔOBD) hMilton1 were immunoprecipitated from 100μM PUGNAC-treated HEK293T cells and O-GlcNAcylation was quantified as in Figure 3. Loss of the high-affinity interaction increased Milton O-GlcNAcylation. n≥3 independent transfections per condition.
(F-H) Full length and truncated OGT constructs lacking either the first 2.5 or 6 TRP motifs (Δ2.5, Δ6 as shown in F) were coexpressed in HEK293T cells with full length hMilton1 (WT) to evaluate the significance of the TPR motifs on OGT/Milton complex formation and the level of hMilton1 O-GlcNAcylation. myc-hMilton1 was immunoprecipitated and immunoblots were analyzed with anti-GlcNAc, anti-myc and anti-OGT. n=3 independent transfections per condition.
(I–K) Hippocampal neurons were transfected with Mito-DsRed and either full length or Δ2.5 or Δ6 truncated OGT and imaged 3 days after transfection. From kymographs as in (I and J), mitochondrial motility was quantified (K) and compared with control. n=111–209 mitochondria from 10–12 axons and 3 independent transfections per condition. n.s. not significant. *p< 0.05, **p<0.01; One-way ANOVA, Kruskal-Wallis test. All values are shown as mean ± SEM. Scale bar represents 10μm and 100s. See also Figure S3 and Table S1C.

