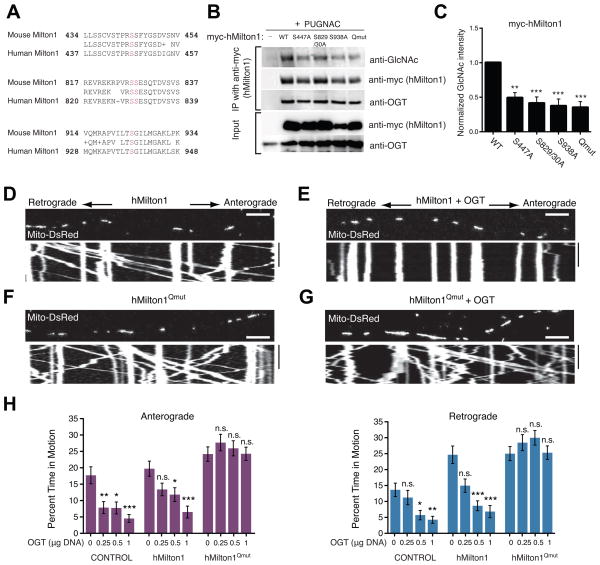
Figure 5. OGT-Dependent Mitochondrial Motility Arrest Requires Milton O-GlcNAcylation.
(A) Sequence alignment of O-GlcNAcylation sites (magenta) in mouse Milton1 with homologous regions in hMilton1 (see also Figure S5 and Table S1D).
(B–C) Myc-hMilton1 with either individual putative GlcNAc sites mutated, or the quadruple mutant lacking all four sites (Qmut) or wildtype (WT) were expressed in HEK293T cells and cultured overnight with 100μM PUGNAC. Milton immunoprecipitates were probed with anti-GlcNAc, anti-myc and anti-OGT antibodies and GlcNAcylation levels on Milton were quantified with fluorescently tagged secondary antibodies. The intensity of each GlcNAc band was normalized to the intensity of the myc band, with the baseline hMilton1 GlcNAc level set as 1 to reveal relative changes. n≥3 independent transfections per condition.
(D–G) Hippocampal neurons were transfected with Mito-DsRed and the indicated forms of hMilton1, with (E and G) or without (D and F) OGT (0.5 μg OGT DNA/well). Mitochondrial motility was imaged 3 days after transfection. (H) To assess the effect of the mutated GlcNAcylation sites, a dose/response relationship was established with different levels of DNA for OGT transfection and its effect on mitochondrial motility quantified from kymographs as in (D–G). The amount of OGT DNA transfected per well of a 24-well plate is indicated. n=75–174 mitochondria from 8–9 axons and 3 independent transfections per condition. All values are shown as mean ± SEM. The significance of changes in motility was determined relative to the motility in neurons expressing the same Milton construct without OGT transfection. n.s. not significant. *p< 0.05, **p<0.01, ***p<0.001; One-way ANOVA, Kruskal-Wallis test. Scale bar represents 10μm and 100s. See also Figure S5, Movies S7–S8 and Table S1E.

