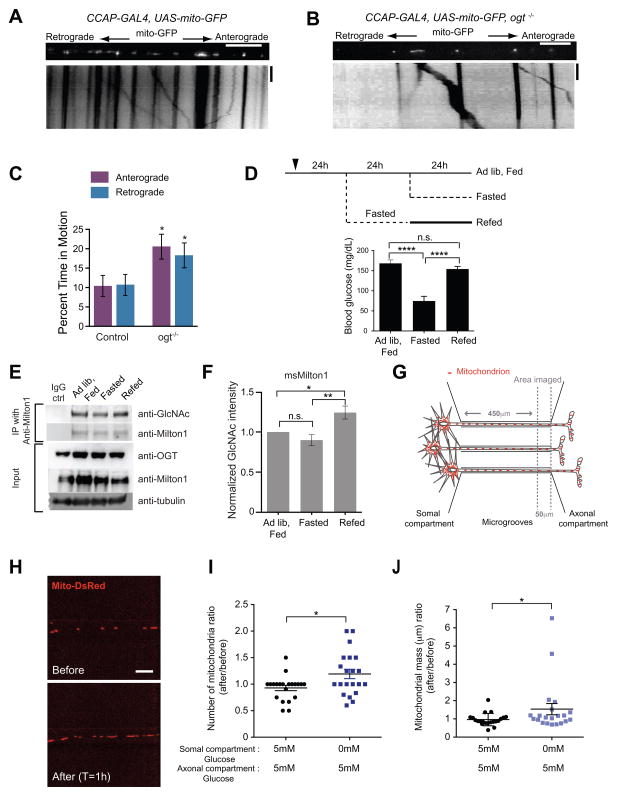
Figure 7. Evidence of OGT-Dependent Regulation of Milton O-GlcNAcylation in vivo.
(A–B) In control and ogt−/− larvae UAS-mito-GFP was expressed in an identified peptidergic axon within the segmental nerve by CCAP-GAL4. (C) The percent time each mitochondrion spent in anterograde and retrograde motion was calculated from kymographs as in (A and B). n=91–100 mitochondria from 9 axons from 9 animals. Scale bar represents 10μm and 100s.
(D) Schematic of the experimental regimen for changing blood glucose levels by fasting and re-feeding and measured blood glucose levels from the mice that were used to compare Milton O-GlcNAcylation levels in the brain.
(E–F) Immediately after blood glucose measurements, two cortical hemispheres were removed and homogenized. Milton1 was immunoprecipitated (E) and GlcNAcylation levels on Milton were quantified (F). n=6 pairs of animals.
(G) Schematic of the microfluidic-based culture platform. The culture chamber consists of fluidically isolated somal and axonal compartments connected by microgrooves. Glucose levels in the axonal and somal compartments were independently manipulated and mitochodria were imaged in a 50μm length of axon at the proximal end of the axonal compartment.
(H–J) Hippocampal neurons, cultured in microfludic devices in 5mM glucose (with 1mM lactate and pyruvate), were transfected with Mito-DsRed. The medium in the somal compartment was replaced with either the same solution or with a glucose-free medium (with 1mM lactate and pyruvate). The same axons were imaged both before and 1h after this solution change (H) so that its effect on mitochondrial density and mass could be quantified (I–J). n= 21 axons, 4 microfluidic devices per condition, 3 independent experiments.
All values are shown as mean ± SEM. n.s. not significant. *p< 0.05, ****p<0.0001, Mann-Whitney U test, One-way ANOVA, Kruskal-Wallis test. See also Figure S6.

