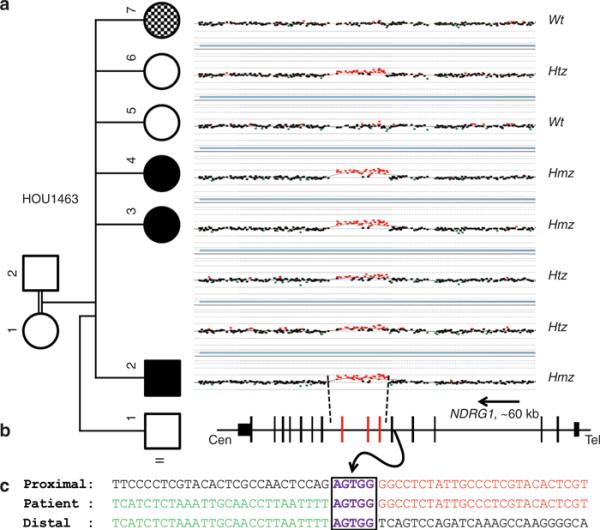
Figure 1. Array comparative genomic hybridization (aCGH) results of the NDRG1 gene region in family HOU1463 and breakpoint junction analysis.

(a) aCGH segregation study within the family. Left column shows the pedigree with four affected (three black boxes indicate CMT4D, and the checkered box indicates the different, more severe neuropathy, and the intellectual disability of the phenotypically distinct sister) and three unaffected individuals born from apparently healthy individuals. Right column shows the figure of custom microarray (Agilent 8 × 60K) for all individuals available for study (II-1 was unavailable for molecular studies). Wt indicates wild type, Hmz indicates homozygous, and Htz indicates heterozygous alleles. (b) Graphic view of 16 exons (vertical black and red bars) of NDRG1. Red bars indicate the duplicated exons (exon 6 through 8). Size and orientation of NDRG1 is shown above the exons. (c) Breakpoint sequence analysis of the duplication. The proximal and distal sequences refer to reference sequence and to their position from the centromere. Proximal reference sequence and patient breakpoint sequences that match with proximal reference sequence are shown in red and distal reference sequence and patient breakpoint sequences that match with distal reference sequence are shown in green. Boxed sequences (purple) correspond to regions of microhomology and emphasize the sequence structure at breakpoint junction.
