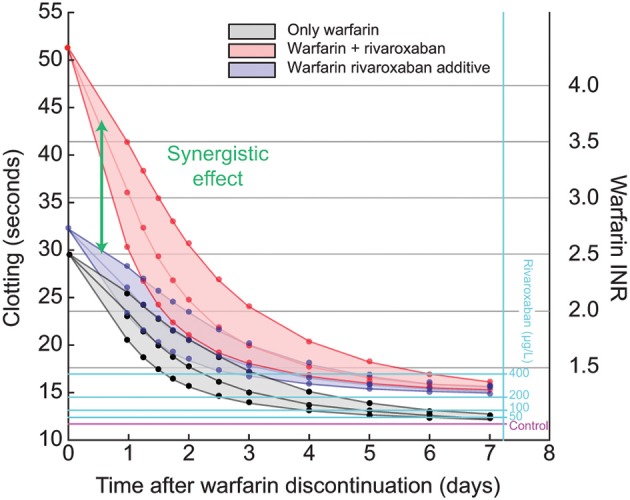
Figure 4.

Synergistic effect of warfarin and rivaroxaban (200 μg/L) after warfarin discontinuation. Black lines show the prothrombin time (PT) as a function of time after warfarin discontinuation, starting at an international normalized ratio (INR) of 2.5, simulated for Caucasians. Rivaroxaban exposure of 200 μg/L causes a PT prolongation of about 3 s in a patient not on warfarin therapy. Blue lines show the hypothetical additive effect of warfarin and rivaroxaban exposure of 200 μg/L. Red lines show the actual simulation of the effect of decaying warfarin plus rivaroxaban (synergistic effect). The center lines are simulated for typical warfarin half-life; lower and upper lines show the same experiments for fast and slow warfarin decay, respectively, using half-lives as reported previously (Wittkowsky, 2003). Light blue lines show the effect of different degrees of rivaroxaban exposure for comparison.
