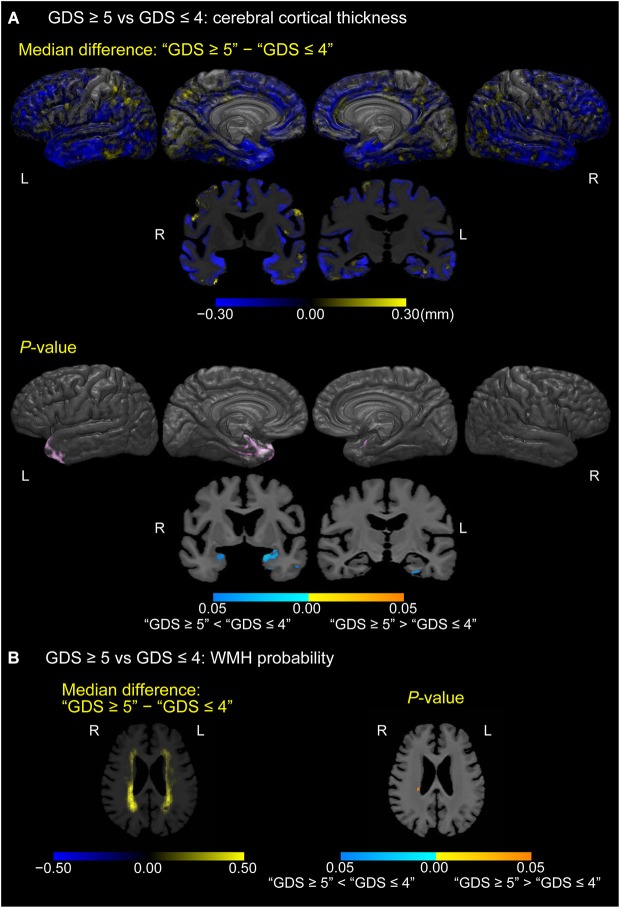
Figure 4.
Differences in cerebral cortical thickness and WMH probability between depressed and non-depressed MCI participants. (A) Cortical maps of median cortical thickness (MCI with GDS ≥5 − MCI with GDS ≤4; in millimeters) and family-wise error (FWE)-corrected p-values between MCI participants with “GDS ≥5” and “GDS ≤4.” (B) White matter maps of median differences in WMH probability (“GDS ≥5” − “GDS ≤4”) and FWE-corrected p-values between MCI participants with “GDS ≥5” and “GDS ≤4.” These results are overlaid on the skull-stripped study-specific template, adjusted for effects of age, gender, and years of education.

