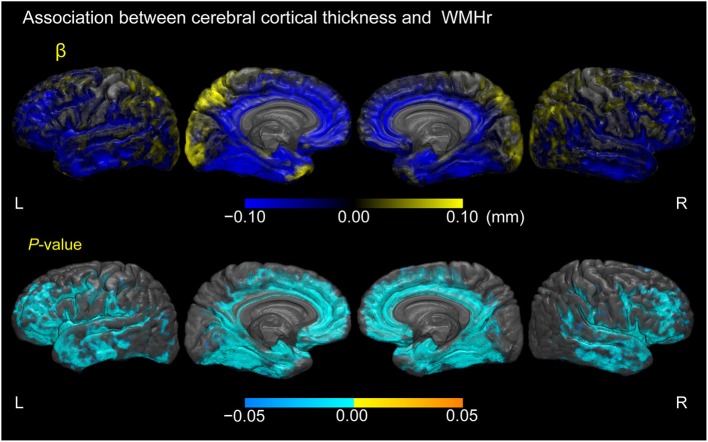
Figure 5.
Association between cerebral cortical thickness and white matter hyperintensity volume as a percentage of the total intracranial volume in participants with MCI. Cortical maps of regression coefficients (unstandardized beta values) and FWE-corrected p-values. The regression coefficients represent the estimated contribution to cerebral cortical thickness as millimeters per unit increase in WMH volume as a percentage of total intracranial volume. These results are overlaid on the skull-stripped study-specific template, adjusted for effects of age, gender, and years of education.

