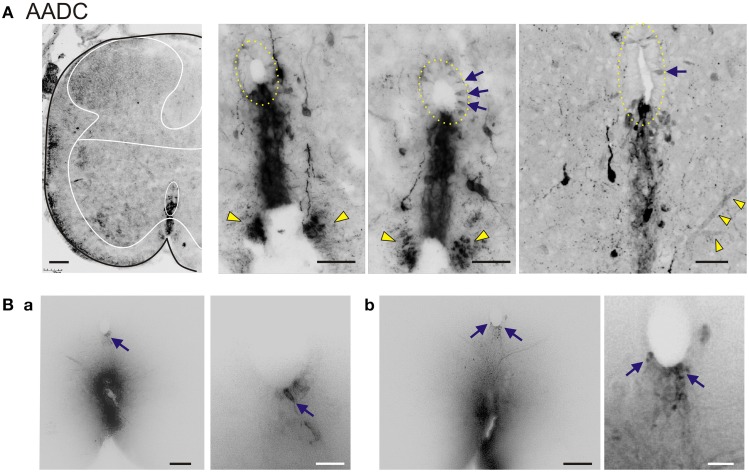
Figure 2.
AADC neuronal subpopulations in the neonatal rat lumbar spinal cord. (A) Left Low power transverse spinal cord section (10 μm) of AADC immunolabeling. Superimposed is an outline of the spinal cord (black) with interior white lines approximately identifying dorsal and ventral gray matter and central canal region. Note strongest labeling is associated with D cells intermingled with epithelial cells surrounding the central canal (top arrow). Also, note the associated vertical row of cellular labeling projecting ventrally, and bilateral white matter labeling in the ventral funiculus (bottom arrow). There is also weak AADC immunolabeling in putative motoneurons (in lamina IX below dotted lines). Right Three panels showing higher power images from separate sections illustrate the diversity of AADC labeling in the ventral medial gray matter region. Epithelial cell layer surrounding central canal is outlined while blue arrows point to example D cells. Common to all is the vertical stream of projections with intermingled cells ventral to the central canal. These appear to end in a white matter tract in the ventral funiculus (yellow arrowheads). Last panel at right is a z-stack of 25, 0.4 μm consecutive images. Note the AADC+ blood vessel at bottom right identified by yellow arrowheads. (B) Central canal cells project to the ventral funiculus. DiI crystals were placed on fixed lumbar spinal cords at the medial ventral funiculus or just lateral to it and allowed to diffuse to identify gray matter projections sites. Shown are two 70 μm thick transverse sections (a,b) from a P14 rat 1 week after with a mid-thoracic spinalization. Images are presented as grayscale with contrast enhancement. Note that when dye placement contacts the midline tract, neurons associated with the central canal are retrogradely labeled. Panels at right are magnified images to highlight retrogradely-labeled neurons in the central canal (corresponding arrows). Scale bars are: (A), 100 μm (left) 50 μm (right three); (Ba,Bb), 100 and 25 μm for left and right images, respectively.

