Figure 1.
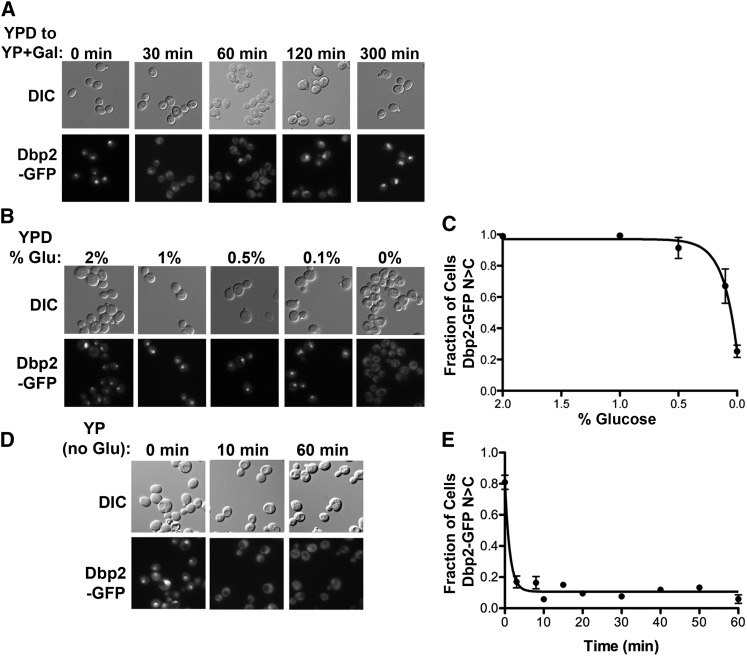
Dbp2 is redistributed to the cytosol upon glucose deprivation. (A) The nuclear Dbp2–GFP signal is rapidly lost during a shift from glucose to galactose media. Dbp2–GFP cells were grown in the presence of 2% glucose (YPD) and shifted to media with 2% galactose (YP + Gal). Fluorescent images were collected by microscopy at the indicated time points following the shift. (B) Nuclear Dbp2–GFP signal decreases with lower glucose concentrations. Yeast cells expressing a C-terminally GFP-tagged Dbp2 encoded within the endogenous DBP2 locus were grown to early log phase (0.1 OD at 600 nm) at 30° in rich media + 2% glucose (YPD) and then shifted to media with the indicated glucose concentrations for 30 min. The localization of Dbp2–GFP was determined by fluorescent microscopy (bottom) with corresponding DIC images (top). All images were collected with the same exposure time and are scaled equivalently. (C) Graphical representation of glucose-dependent nuclear localization of Dbp2. Dbp2–GFP localization was determined as above over a range of glucose concentrations. The fraction of cells with a predominantly nuclear Dbp2–GFP signal is reported for each glucose concentration tested. Graphical points represent the average of three biological replicates with >100 cells per replicate counted and scored. Error bars represent the SEM. (D) Dbp2 is rapidly lost from the nucleus after glucose removal. Fluorescence microscopy images of Dbp2–GFP localization at the indicated time points following depletion of glucose (YP) are shown. DIC and fluorescent microscopy images were collected as above following growth of Dbp2–GFP-expressing yeast cells in rich media with glucose to early log phase and subsequent removal by centrifugation and resuspension in media lacking glucose. (E) Graphical analysis of the rate of nuclear Dbp2–GFP loss following removal of glucose. The time for Dbp2–GFP relocalization following glucose depletion was determined by growing Dbp2–GFP-expressing cells in YP+2% glucose as above, rapidly shifting the cells to YP lacking glucose and collecting images by fluorescence microscopy at the indicated time points before (0 min) and immediately following glucose depletion. The fraction of cells with nuclear signal was determined as in C.

