Figure 5.
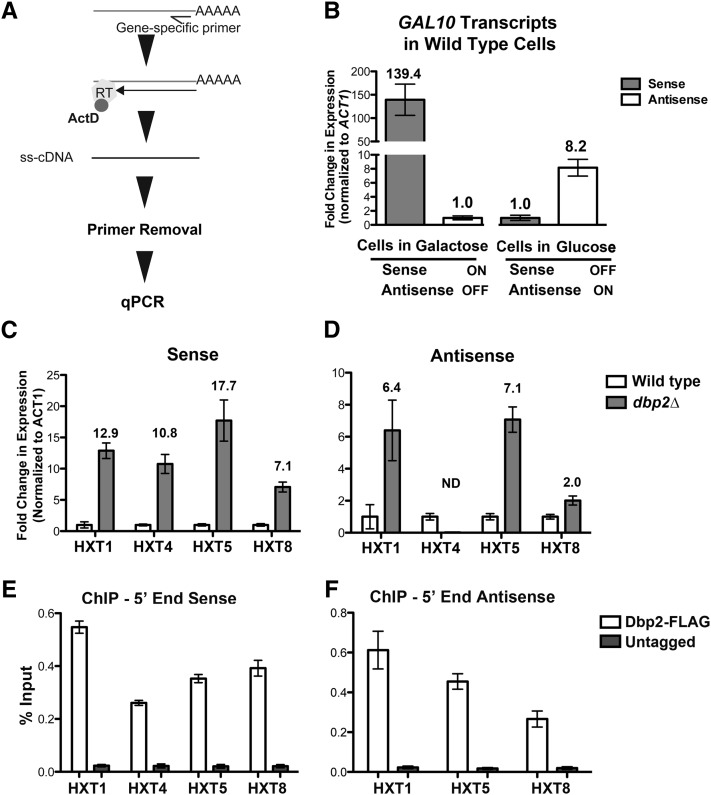
Strand-specific RT-qPCR confirms aberrant HXT transcript accumulation in dbp2∆ cells, correlating with presence of Dbp2 at genomic HXT loci. (A) Stepwise diagram of the strand-specific RT–qPCR method. Reverse transcription is conducted with a gene-specific primer that is complementary to either the sense or antisense strand. Single-stranded cDNA is produced using reverse transcriptase in the presence of actinomycin D (ActD), the latter of which prevents second-strand synthesis (Perocchi et al. 2007). Half arrow denotes primer positioning on targeted RNAs whereas complete arrow indicates reverse transcriptase activity. Unincorporated primers are removed using column chromatography and the resulting cDNA is quantified using PCR and SYBR green detection. (B) Single-stranded RT–qPCR measures expression of mutually exclusive GAL10 sense and antisense transcripts. Total RNA was isolated from wild-type cells grown in triplicate in either glucose or galactose media (for expression of antisense or sense GAL10 transcripts, respectively) and subjected to transcript-specific cDNA preparation. Gene-specific primers for ACT1 were also included in the reverse transcription reaction as an internal control for downstream quantification. Fold change in expression was calculated for each growth condition independently and is shown relative to the minority transcript (i.e., transcripts from cells grown in galactose are normalized to antisense GAL10 and to sense GAL10 for glucose-cultured cells), which is set to 1 for representation. Numbers above each bar show the average fold change with error bars reflecting the SE.M. (C and D) Independent validation of HXT sense and antisense transcript abundance using strand-specific RT–qPCR. The fold enrichment of representative HXT sense and antisense transcripts in dbp2∆ cells over wild type was determined using strand-specific RT–qPCR as above. Transcript abundance was normalized with respect to ACT1 transcript levels, a transcript whose levels do not vary between wild-type and dbp2∆ cells (Cloutier et al. 2012), and is the average of three independent biological replicates and the SEM. ND, not detectible. (E) Dbp2 interacts directly with 5′ region of HXT genes, with respect to the sense transcript. Chromatin immunoprecipitation of 3X-FLAG-tagged Dbp2 vs. and untagged control strain. Primer-probe sets (Table 2) were designed for sites on genomic DNA corresponding to the 5′ regions of the sense transcripts of HXT1, HXT4, HXT5, HXT8. (F) Dbp2 interacts directly with the genomic region encoding HXT antisense transcripts. Chromatin immunoprecipitation of 3X-FLAG-tagged Dbp2 vs. and untagged control strain. Primer-probe sets (Table 2) were designed for sites on genomic DNA corresponding to the 5′ regions of the antisense transcripts of HXT1, HXT5, HXT8. Results are presented as percentage input and are the average of three biological replicates with three technical replicates and the SEM.

