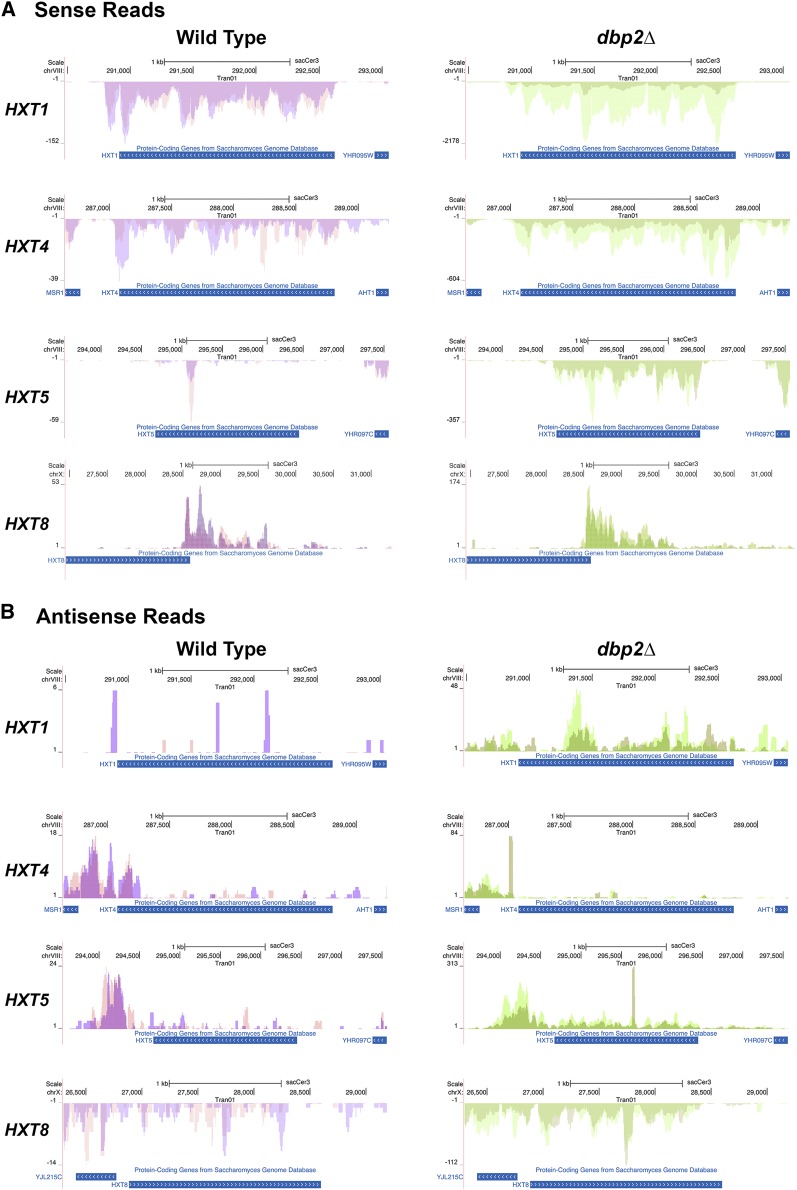
Figure 6.
Mapped RNA seq reads across representative HXT genes. Alignment of mapped RNA sequencing reads shows similar (A) sense and (B) antisense expression patterns in wild-type and dbp2∆ cells. Reads were aligned to the S. cerevisiae genome using the UCSC genome browser. Images were generated directly through the UCSC website and show reads that correspond to the annotated, protein-coding gene. Reads on the top correspond to Watson strand-encoded transcript whereas reads on the bottom of each graph align to a gene encoded on the Crick strand. Arrows within the gene ORF rectangle indicate orientation of the sense transcript within the genome. Sense and antisense transcripts are displayed on different graphs due to differences in abundance and resulting graphical scaling. Note that the y-axis is different between wild-type and dbp2∆ cells due to expression level differences between these two strains.

