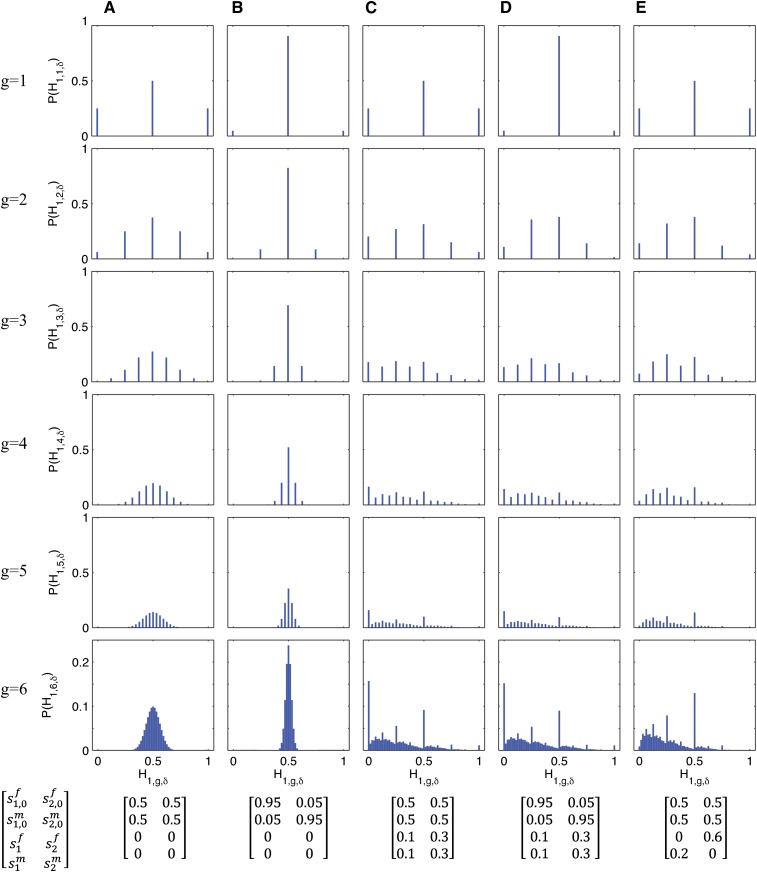
Figure 2.
Probability distribution of the fraction of admixture from source population S1, , for a random individual from the hybrid population for the first six generations (Equations 9–11). Each column (A, B, C, D, E) corresponds to a specified admixture scenario, with constant contributions from the source populations over time after founding ( for each α ∈ {1, 2}, δ ∈ {f, m}, and g ≥ 2).

