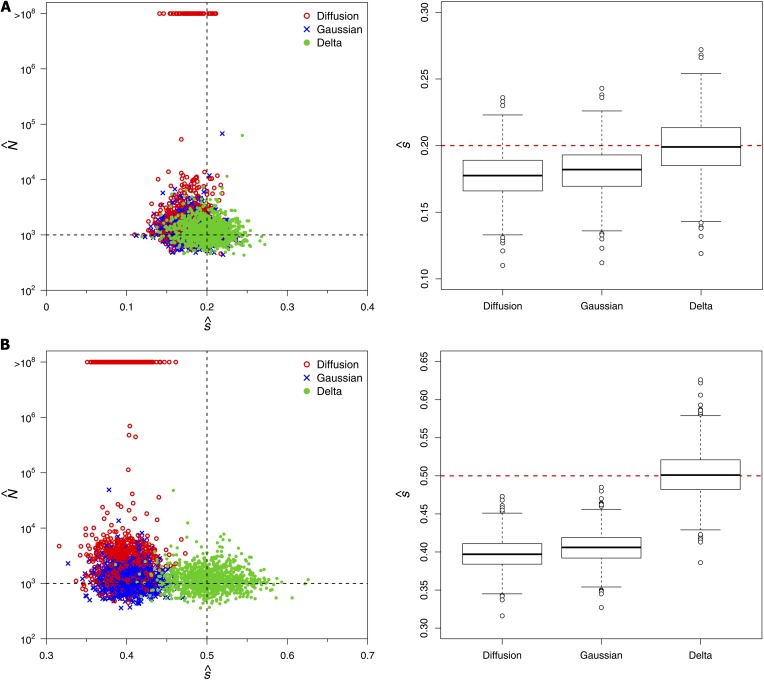
Figure 2.
MLEs for N and s obtained in 1000 data sets simulated with N = 1000 and (A) s = 0.2 and (B) s = 0.5. Estimates were based on the mutant frequencies observed in samples of size 10000 taken every generation for 20 generations of the process, starting with an initial population mutant frequency of p = 0.05 in A and p = 0.01 in B.

