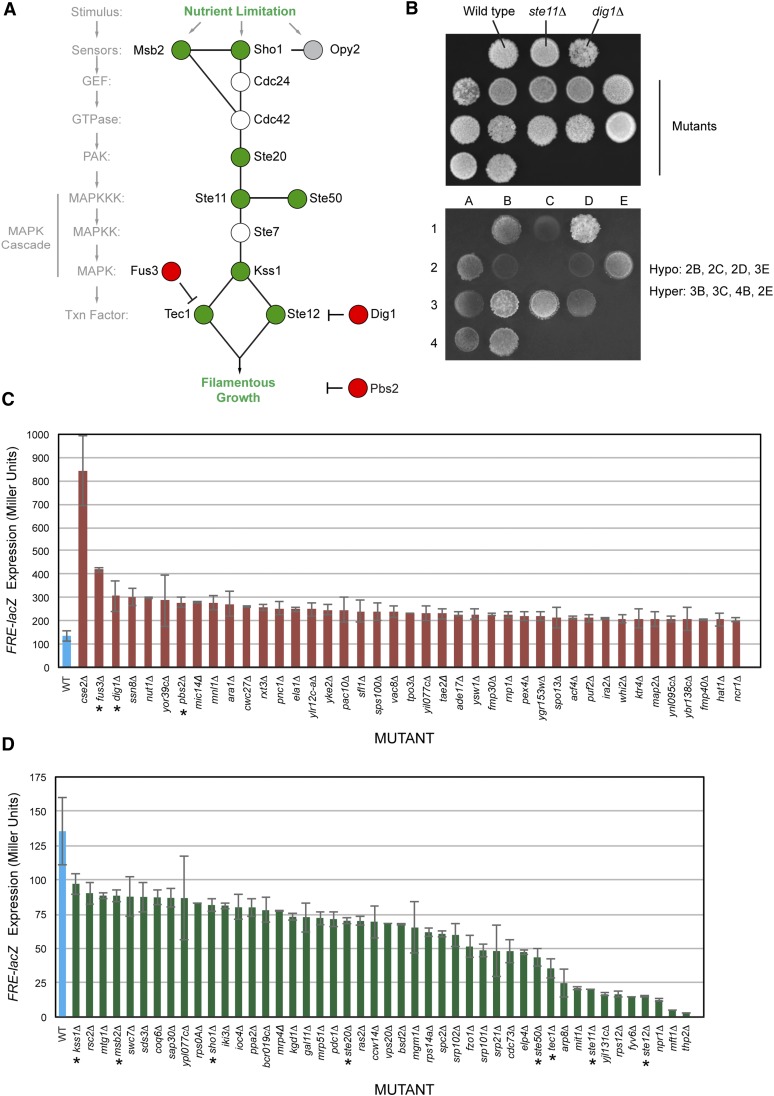
Figure 1.
Positive and negative regulators of the filamentous growth MAPK pathway. (A) The filamentous growth MAPK pathway is shown with components that were identified by the screen represented as positive regulators (green circles) and negative regulators (red circles). Cdc24p and Cdc42p are essential proteins and were not tested here, and Ste7p was not present in the collection. Opy2p is an established regulator of the filamentous growth MAPK pathway (Yang et al. 2009, 2010; Karunanithi and Cullen 2012) and showed a defect in FRE–lacZ expression, but the levels fell below the range of statistical significance (Table S3). (B) Example of the plate-washing assay. Equal concentrations of cells were spotted onto YEPD media. Cells were grown for 2 days. Plates were photographed (top) and washed in a stream of water to reveal invaded cells (bottom). Examples of hyper- and hypoinvasive growth mutants are listed at right in reference to strains lacking a positive (ste11Δ) and negative (dig1Δ) regulator. (C) Mutants showing elevated pFRE–lacZ expression and hyperinvasive growth. β-Galactosidase assays were performed in at least duplicate. Blue bar, wild-type control strain; red bars, mutants tested. Values are expressed in Miller units (U). Error bars represent standard deviation between independent trials. P-values and raw data provided in Table S3. (D) Mutants showing reduced pFRE–lacZ expression and reduced invasive growth. Blue bar, wild-type control strain; green bars, mutants tested. See C for details. The pFRE–lacZ activity of the kss1Δ did not fall within the 1.5-fold cutoff but is shown as a reference.

