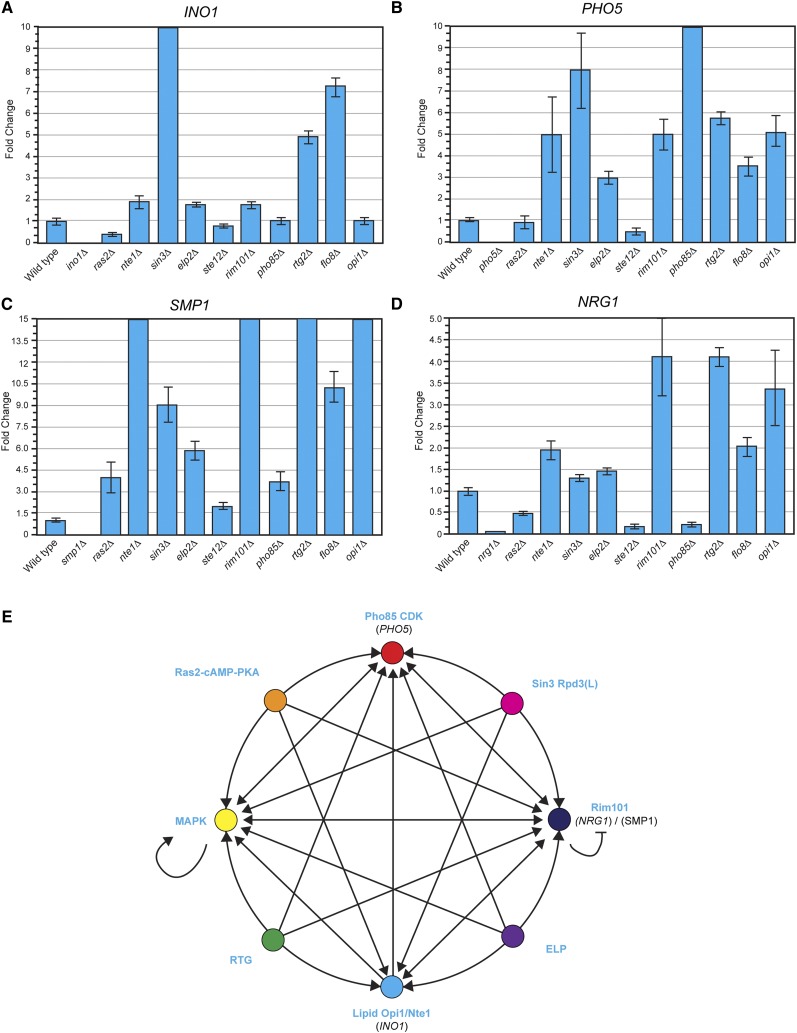
Figure 5.
Signal integration between pathways during filamentous growth. (A–D) Quantitative PCR analysis of labeled genes in the indicated mutants. The bar indicates change in expression using the ΔΔCt quantitation method. Wild-type expression levels were set to 1. The error bars represent standard deviation between experiments. Cells were grown to midlog phase in YEP–GAL media for 6 hr. (E) Diagram showing connections between pathways that regulate filamentous growth. Arrows refer to positive regulation. Bars, negative regulation.

