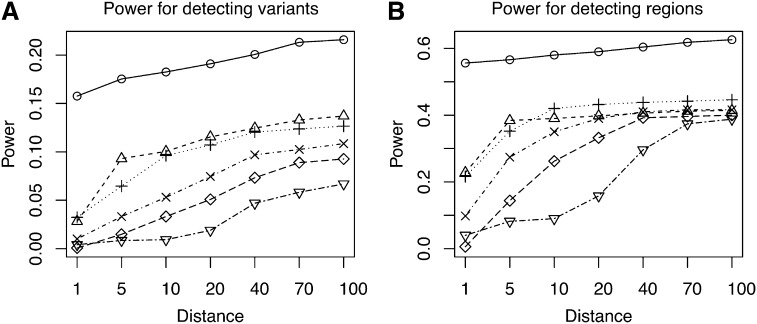
Figure 5.
Power comparison between BEAM3 and SKAT: (A) Power for detecting variants and (B) power for detecting regions. Distance: maximum allowed number of SNPs between the center of a reported significant SNP set (data-wide P-value 0.01) and the nearest true disease variant, such that the true variant is counted toward power. SKAT: in the parentheses shows the number of SNPs per set. o: BEAM3; Δ: SKAT(10); +: SKAT(25); x: SKAT(50); ⋄: SKAT(100); ∇: SKAT(200)

